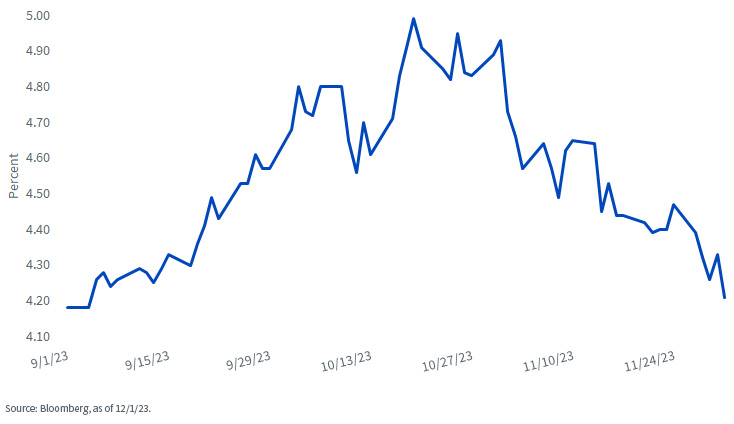
U.S. Treasury 10-Year Yield

Let’s go to the videotape for some perspective. As the graph highlights, the UST 10-Year yield has now essentially reversed the entire increase it experienced in September and October. Just what did that entail, exactly? A move of roughly 80 basis points (bps), first to the upside, and now to the downside. Remember, how I blogged about volatility in the bond market last week? Well, it doesn’t get more volatile than that in bond-land.
Typically, a reversal in yields of the magnitude we are discussing, especially in such a relatively short period, would require a sea-change in some key ingredient such as the economy, inflation and/or monetary policy. While the pace of economic growth does appear to be slowing from Q3’s robust reading of 5.2%. Based on the St. Louis Fed GDP Nowcast estimate, it looks like real GDP for Q4 could still be coming in just under 2%, or not too far removed from the first six months of 2023. With respect to inflation, progress continues on this front as well, but the most recent annualized reading on the Fed’s preferred inflation gauge, the core PCE Price Index, came in at 3.5%, or still visibly above the policy maker’s 2% target.
So, that leaves us with the monetary policy quotient and, no doubt, this is where the outlook has shifted dramatically. The money and bond markets have now moved up the timeframe for the first Fed rate cut and increased the cumulative amount of expected decreases for the Fed Funds trading range for 2024. To provide perspective, March of next year is now being viewed as the beginning of the rate cut cycle rather than June/July previously. In addition, the implied probability for Fed Funds Futures has now priced in five or six rate cuts for 2024, for a total of about 125 to 150 bps. In comparison, as recently as October 31, expectations were geared toward three rate cuts worth roughly 75 bps in total.
Conclusion
Arguably, one can make the case that the UST market has already priced in a lot of good news, so in order to maintain yields at current levels (or even lower), validation will be necessary. What does that mean? Economic/labor market data needs to reveal a visible slowing in growth while inflation must continue to show signs of further cooling. These two forces will be necessary for the Fed to begin their forward guidance toward rate cuts, let alone actually lowering the Fed Funds rate. In my opinion, the money and bond market’s newfound optimistic monetary policy outlook may be ripe for some disappointment.
]]>


