
GBP May Undergo Correction: Also, Insights into EUR, JPY, CHF, AUD, Brent, Gold, and the S&P 500 Index.
EUR/USD (Euro vs US Dollar)
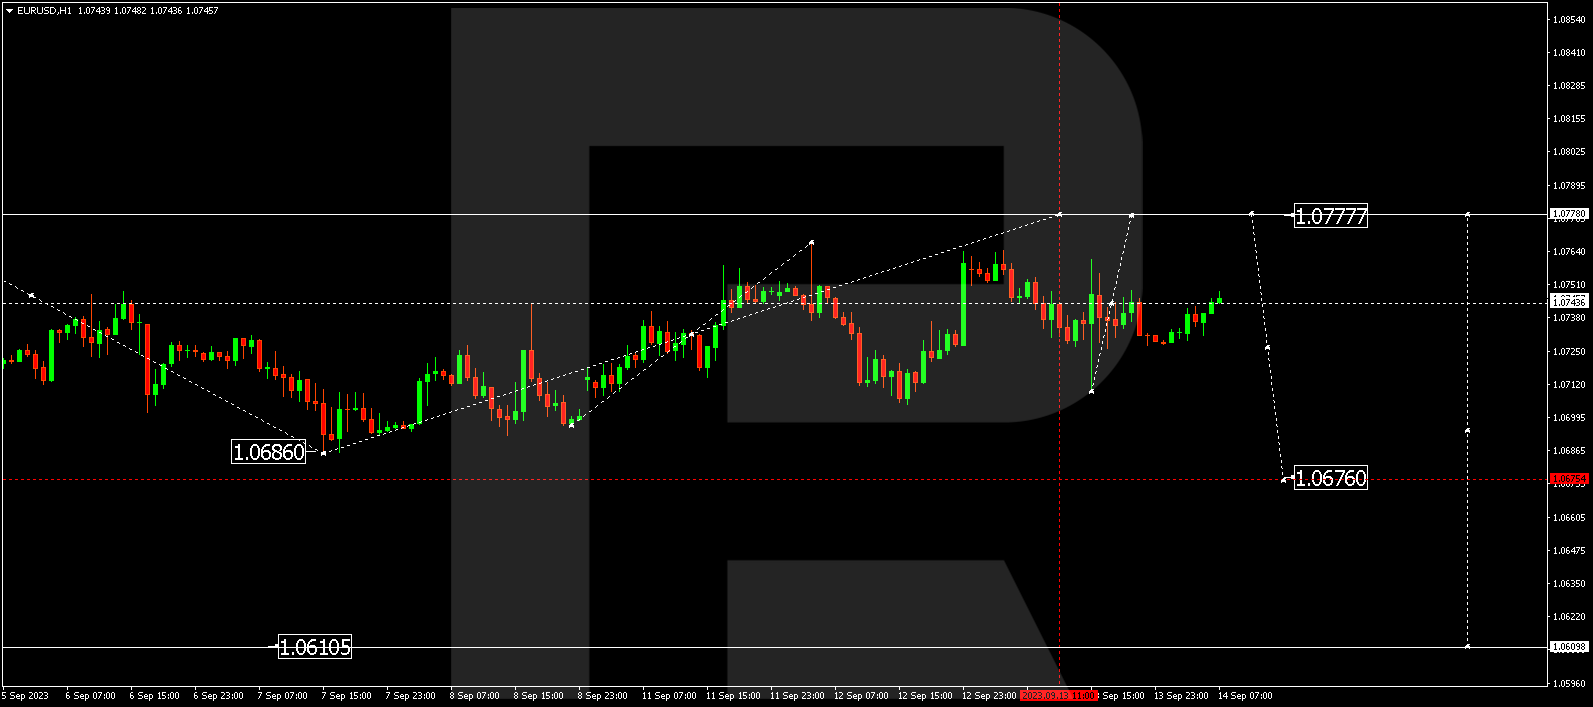
EUR/USD is currently in a correction phase towards 1.0777. After reaching this level, it may decline to 1.0676, representing a local target. Subsequently, a new upward wave to 1.0900 could initiate.
GBP/USD (Great Britain Pound vs US Dollar)
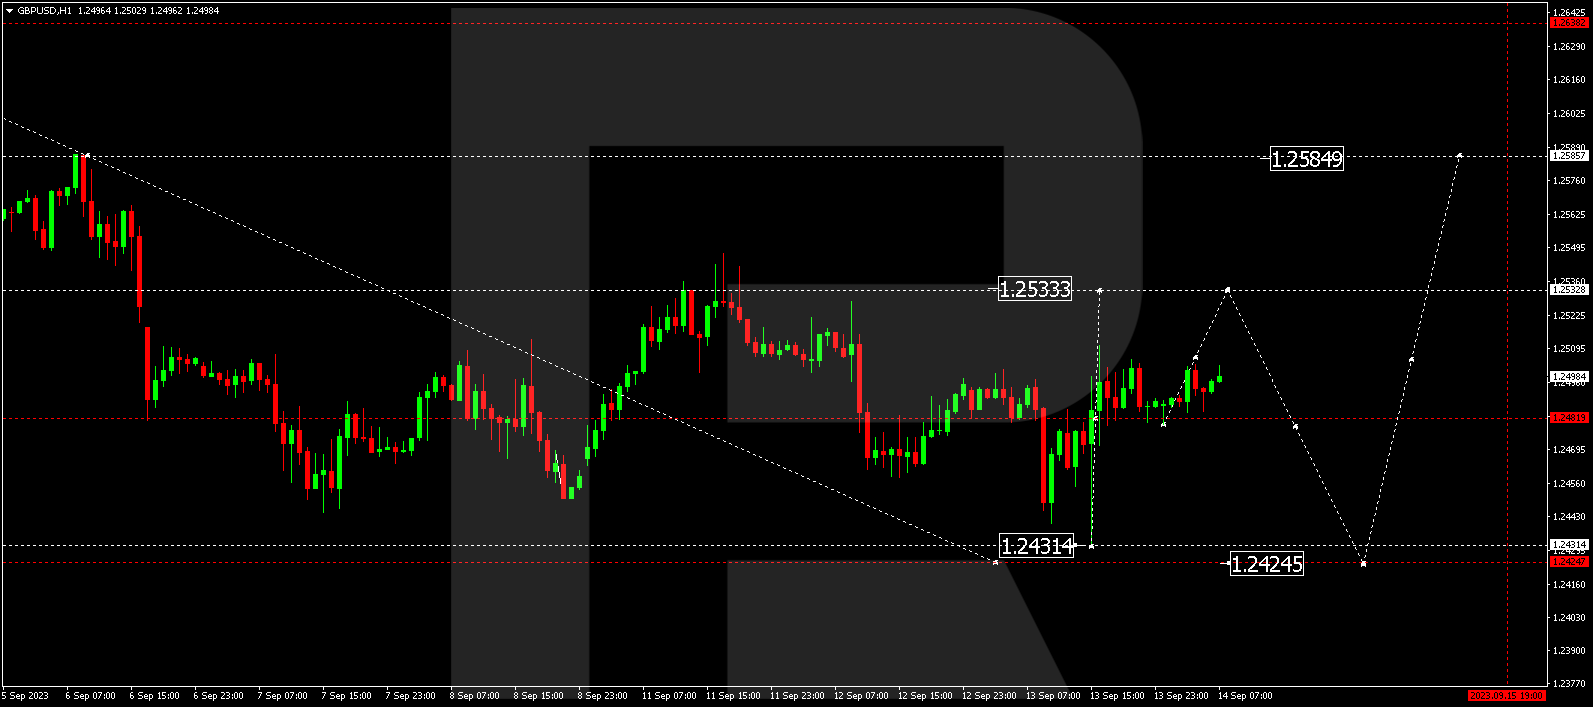
GBP/USD has completed a downward wave to 1.2431. Today, the market is forming a corrective structure towards 1.2533. After reaching this level, a decline to 1.2424 might follow, from where a fresh upward wave to 1.2700 could commence.
USD/JPY (US Dollar vs Japanese Yen)
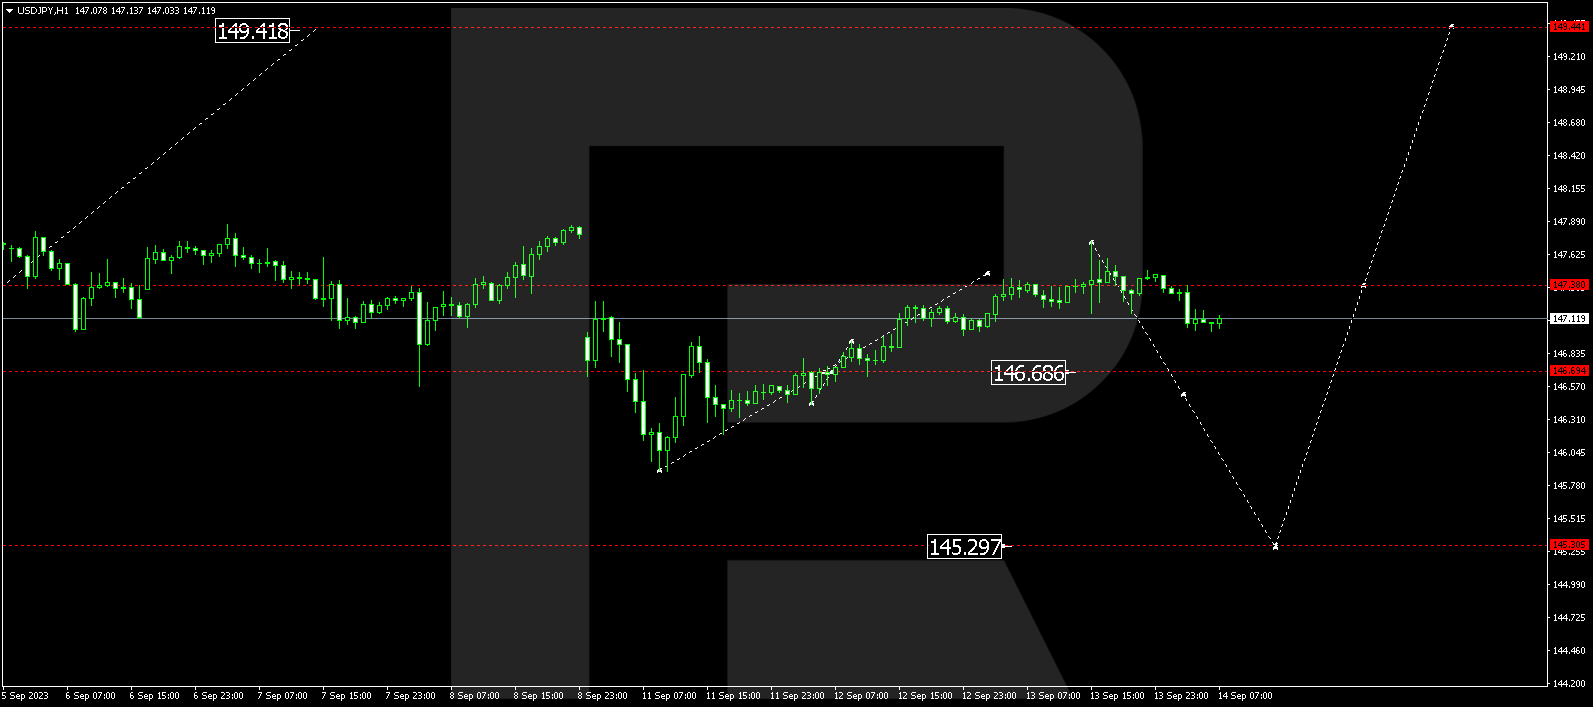
USD/JPY has concluded an upward wave at 147.73. Today, the market has initiated a new downward structure towards 146.55. A break below this level could open the potential for a further correction to 145.30. Once the correction concludes, a new upward wave towards 149.44 is expected to start.
Experience trading in the high-tech R StocksTrader terminal! Real stocks, advanced charts, and a free trading strategy builder. Click on the banner and open an account!
USD/CHF (US Dollar vs Swiss Franc)
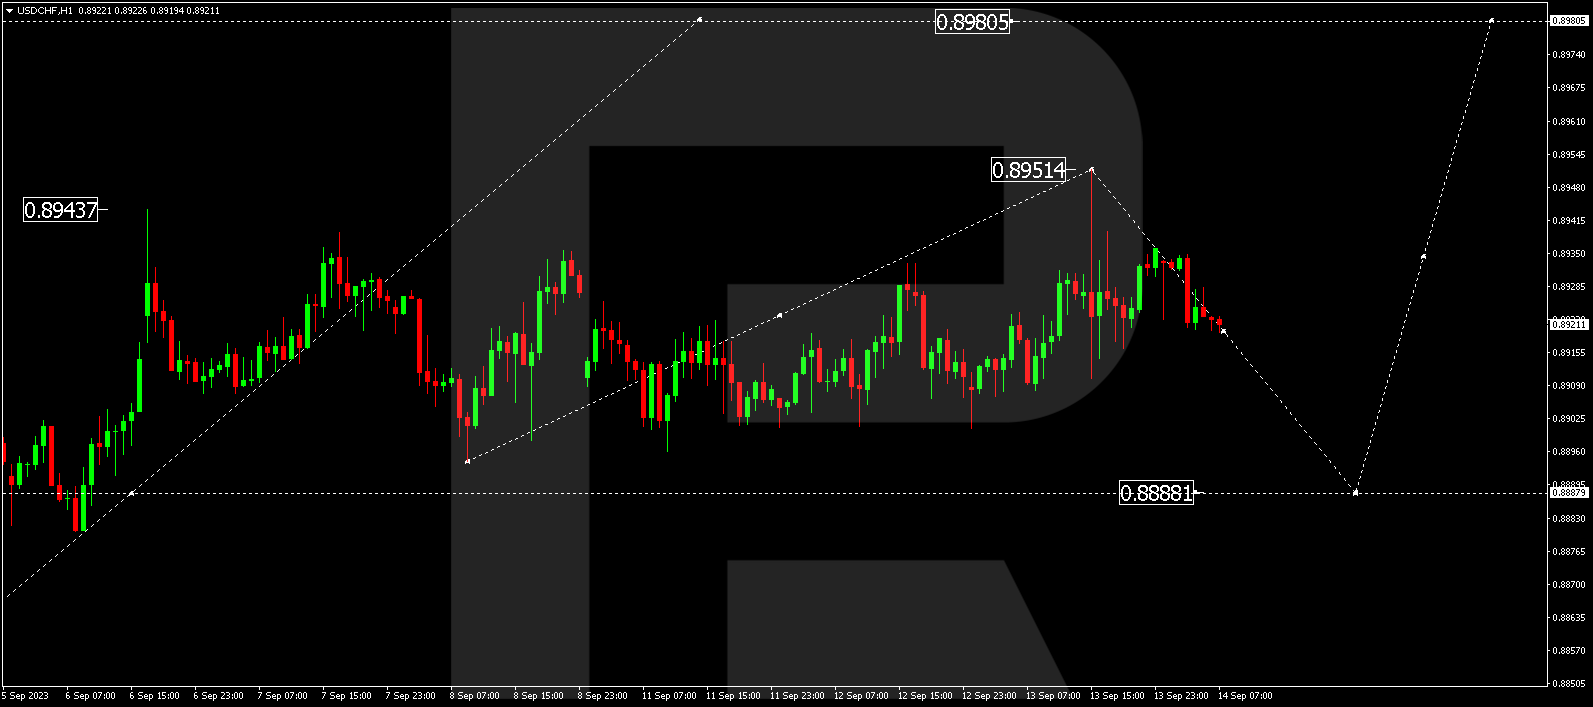
USD/CHF has broken out of a consolidation range upwards, completing an ascending wave structure to 0.8951. Today, the market continues with a corrective wave towards 0.8888. After this correction is completed, a new upward wave to 0.8980 could begin, representing the first target.
AUD/USD (Australian Dollar vs US Dollar)
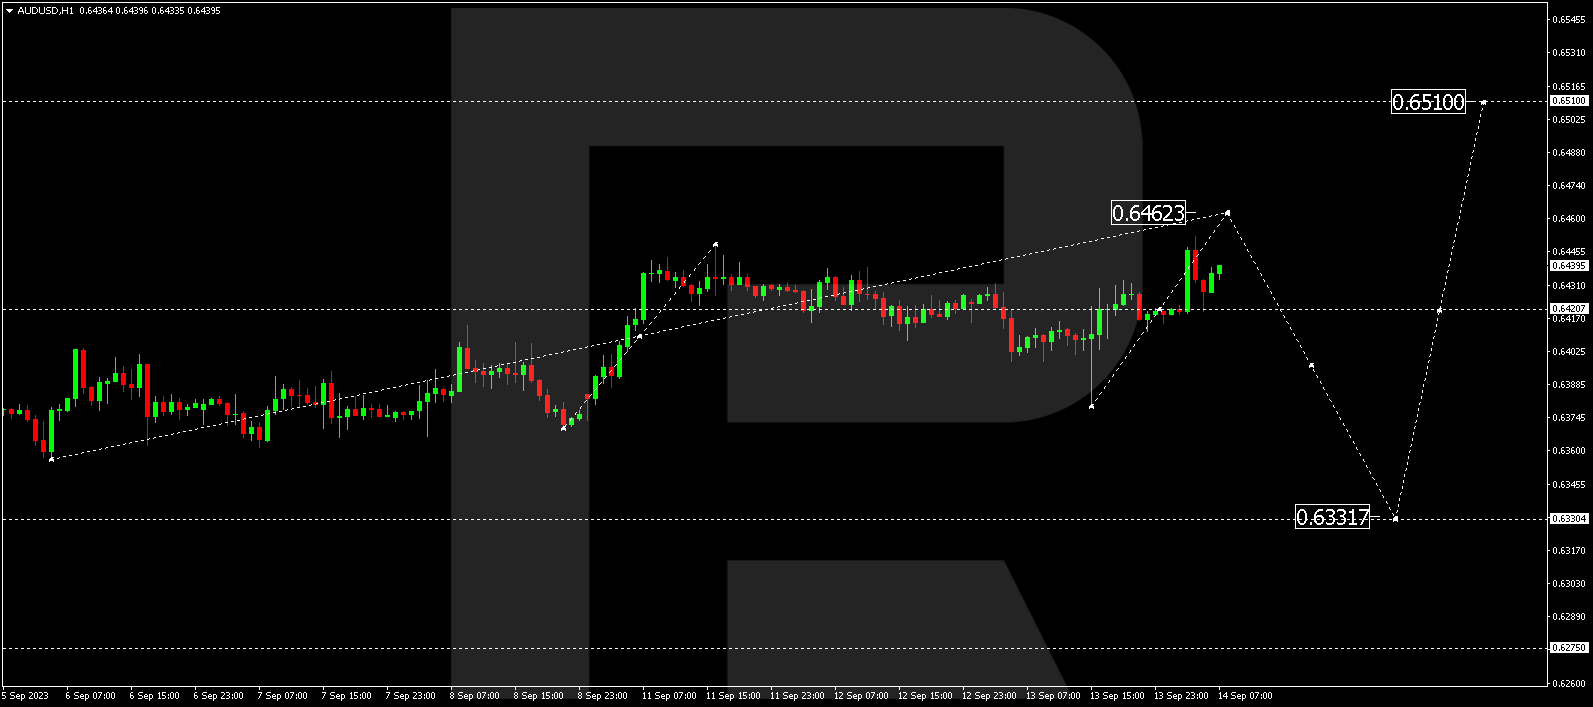
AUD/USD is currently in a correction phase towards 0.6462. After this correction, a new downward wave to 0.6400 could initiate. If this level is also breached downwards, the potential for a trend-driven decline to 0.6333 could open up.
BRENT
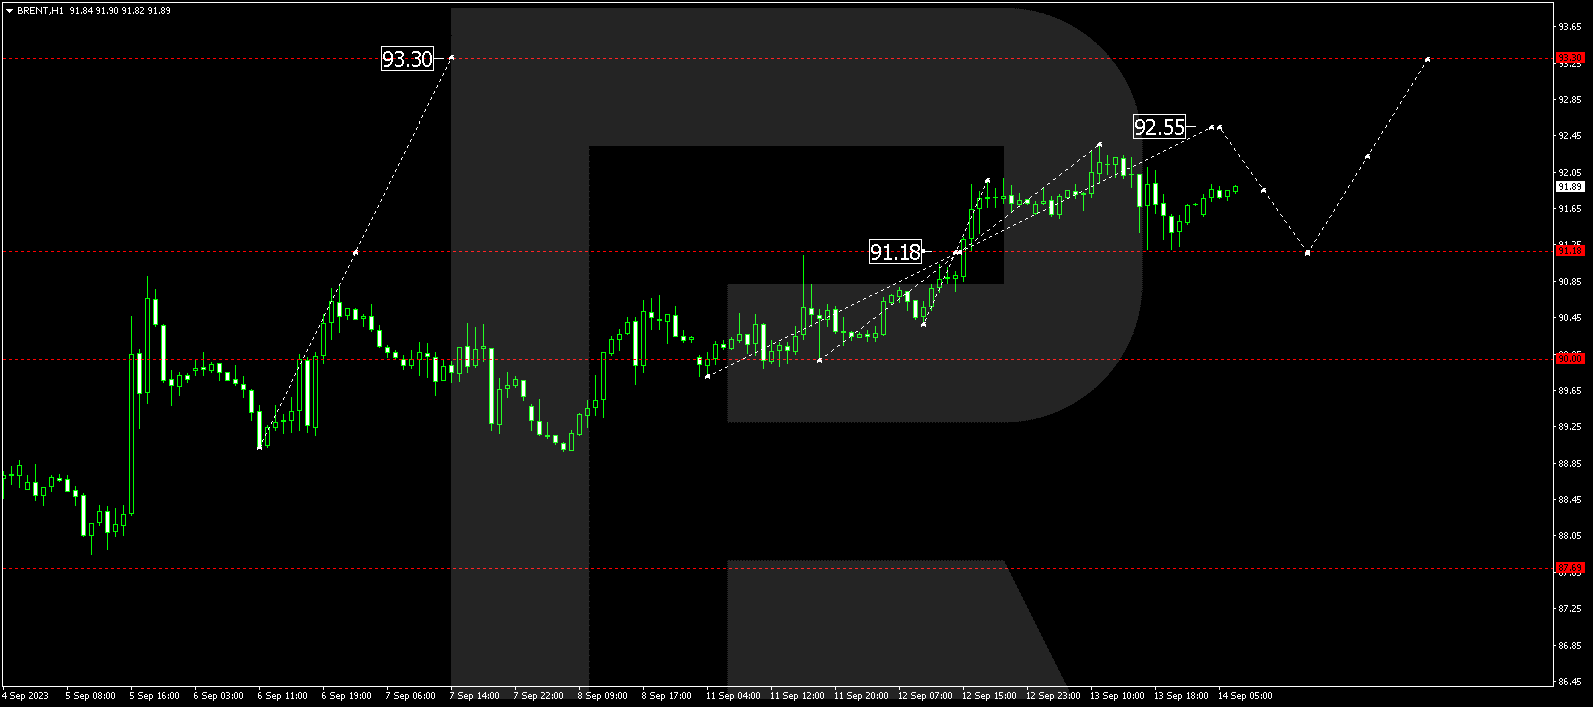
Brent has completed an upward wave to 92.35 and a correction to 91.20. Today, the market continues to rise towards 92.55. After reaching this level, a correction towards 91.20 is not excluded. Next, a rise to 93.30 is expected, after which the trend could continue towards 96.40. This represents a local target.
XAU/USD (Gold vs US Dollar)
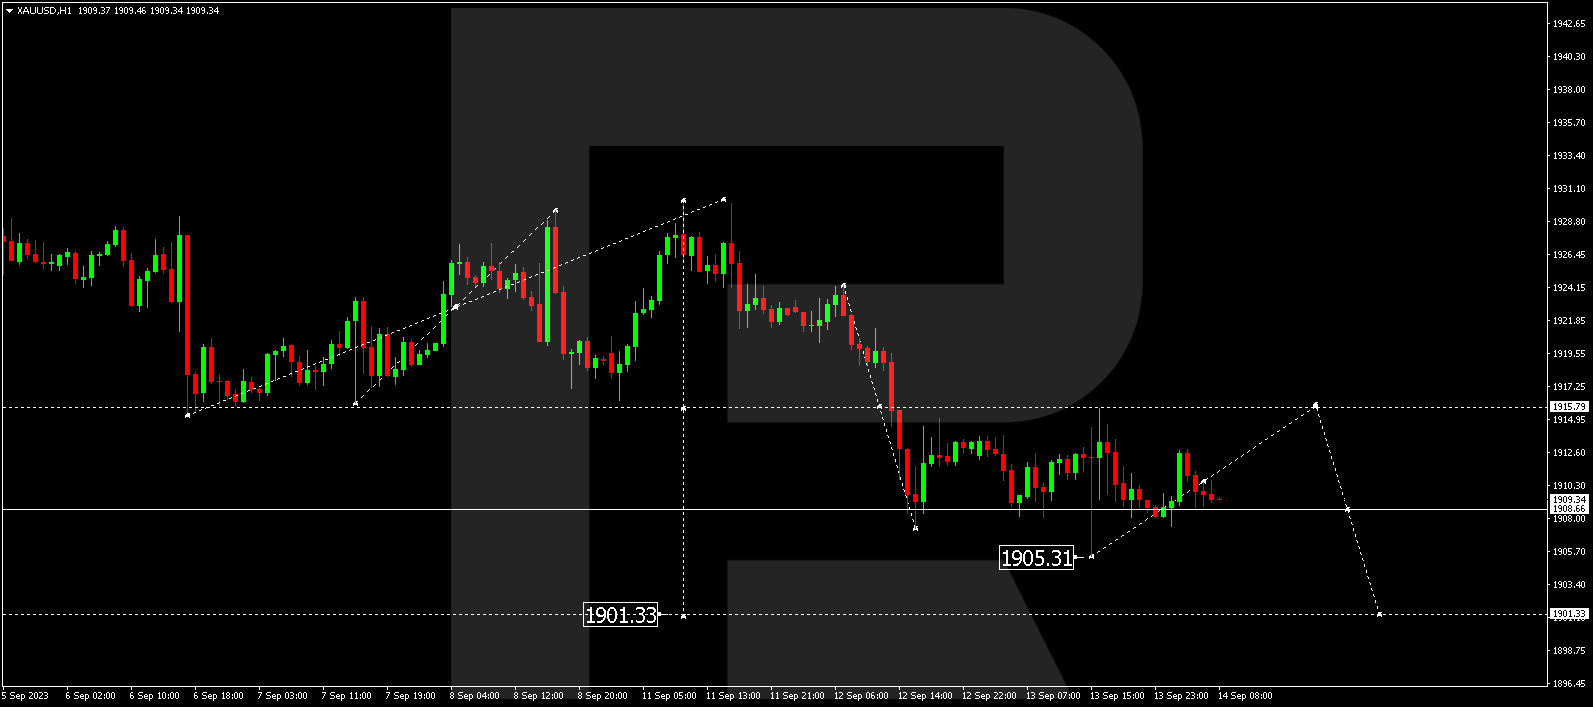
Gold has concluded a downward wave at 1905.33 and a correction at 1915.77. Today, the market continues to decline towards 1904.60. Subsequently, a rise to 1908.66 might occur (with a test from below). Then the price could decline to 1901.33. If this level is also breached downwards, the potential for a trend-driven decline to 1864.00 could open. This is a local target.
S&P 500
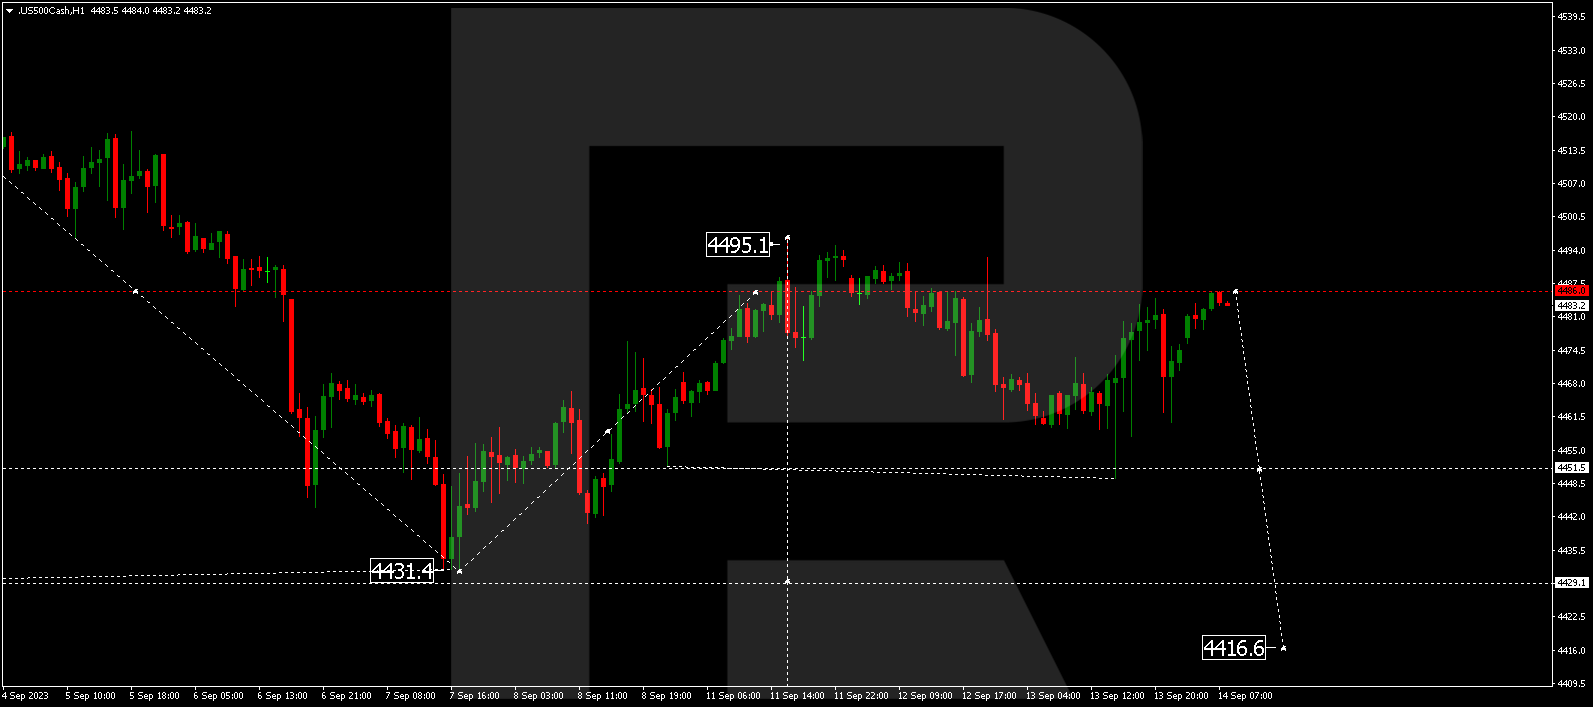
S&P 500 has completed a downward wave to 4451.5. Today, the market has completed an upward wave to 4486.0 (with a test from below). A consolidation range could form below this level. If the range is breached to the downside, the potential for a decline to 4444.0 could open. If this level is also breached, the trend could extend towards 4416.6. This represents a local target.
The post Technical Analysis & Forecast for September 14, 2023 appeared first at R Blog – RoboForex.


