- Russell 2000 has resumed its underperformance against the rest of the US benchmark stock indices after failing to have a follow-through from last Friday’s stellar gain of + 3.56%.
- Major downtrend phase in place since its 8 November 2021 all-time high remains intact.
- Short-term downside momentum has resurfaced below 1,835 key resistance.
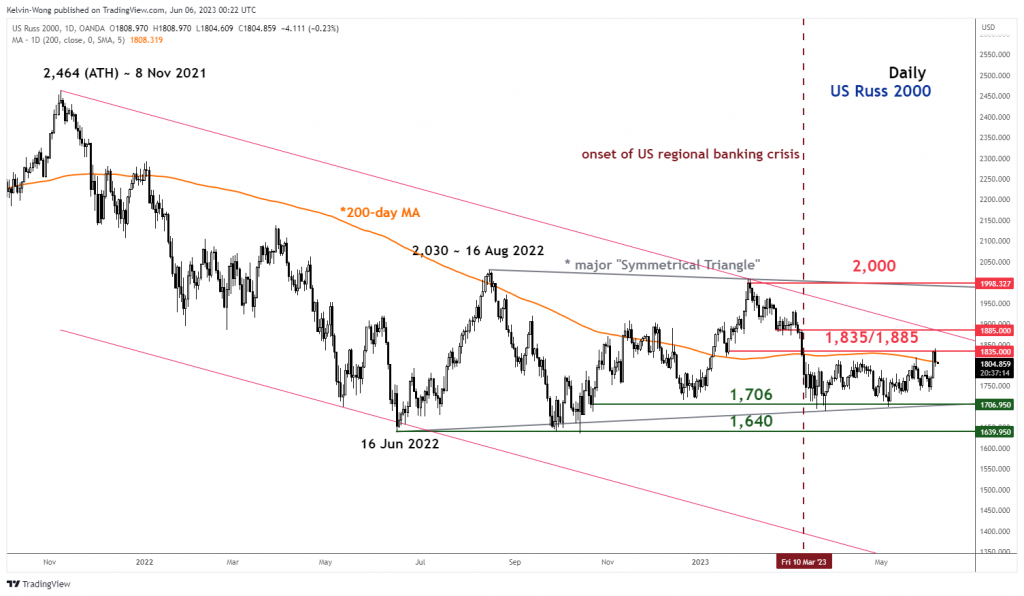
Fig 1: US Russ 2000 major trend as of 6 Jun 2023 (Source: TradingView, click to enlarge chart)
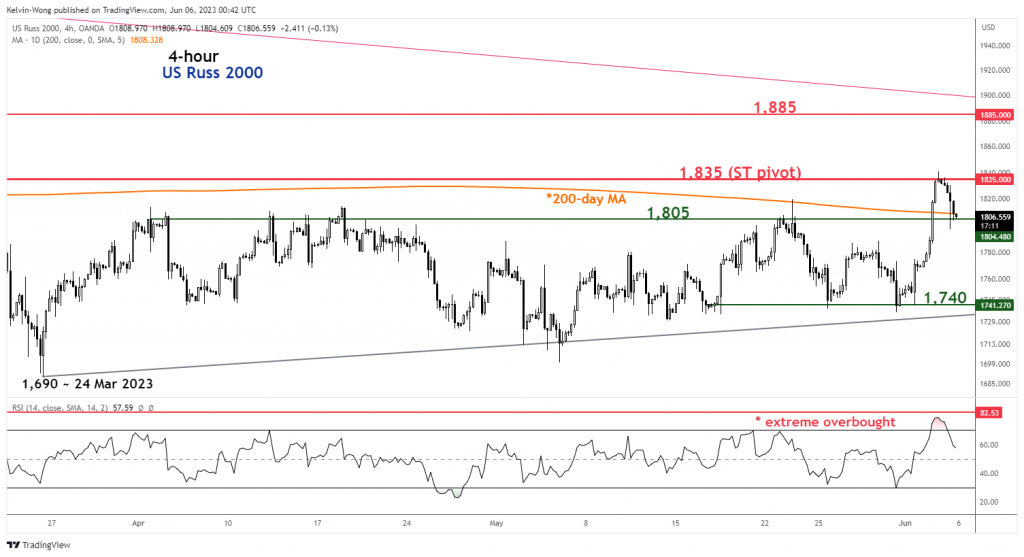
Fig 2: US Russ 2000 minor trend as of 6 Jun 2023 (Source: TradingView, click to enlarge chart)
The small-cap Russell 2000 has resumed its underperformance against the rest of the US benchmark US stock indices after a stellar one-day performance of +3.56% last Friday, 2 June. Yesterday, 5 June, it declined by -1.32% versus S&P 500 (-0.20%), Nasdaq (+0.07%), and Dow Jones Industrial Average (-0.59%) ex-post release of the weaker than expected US ISM Services PMI for May where it fell to 50.3 from 51.9 in April, below consensus estimates of 52.2, an indication of a growth slowdown in services activities reinforced by a decline in its key sub-components as well; Services Business Activity (51.5 vs. 52), and Services New Orders (52.9 vs. 56.1).
Price actions have reintegrated back below its key 200-day moving average
In the longer term, the US Russ 2000 Index (a proxy for the Russell 2000 futures) has continued to evolve in a major downtrend phase in place since its all-time high of 2,464 printed on 8 November 2021 (see daily chart).
Yesterday’s price action has been rejected by a key short-term resistance at 1,835 defined by the former minor swing low of 19/20 January 2022 and 50% Fibonacci retracement of the recent minor decline from the 2 February 2023 high to the 24 March 2023 low and recorded a daily close slightly below the 200-day moving average.
Short-term momentum has turned bearish below 1,835 key resistance
The 4-hour RSI has exited from its overbought region, right below an extremely overbought level of 82.53 printed on 12 January 2023, and still has not reached its oversold region of below 30%.
1,835 key short-term pivotal resistance (see 4-hour chart) to maintain the potential short-term bearish momentum, a break below the 1,805 intermediate minor support exposes the next support at 1,740 (also the minor ascending range support in place since 24 March 2023 low of 1,690)
However, a clearance above 1,835 negates the bearish tone to see the medium-term resistance coming in at 1,885 (the upper boundary of the major descending channel from 8 November 2021).


