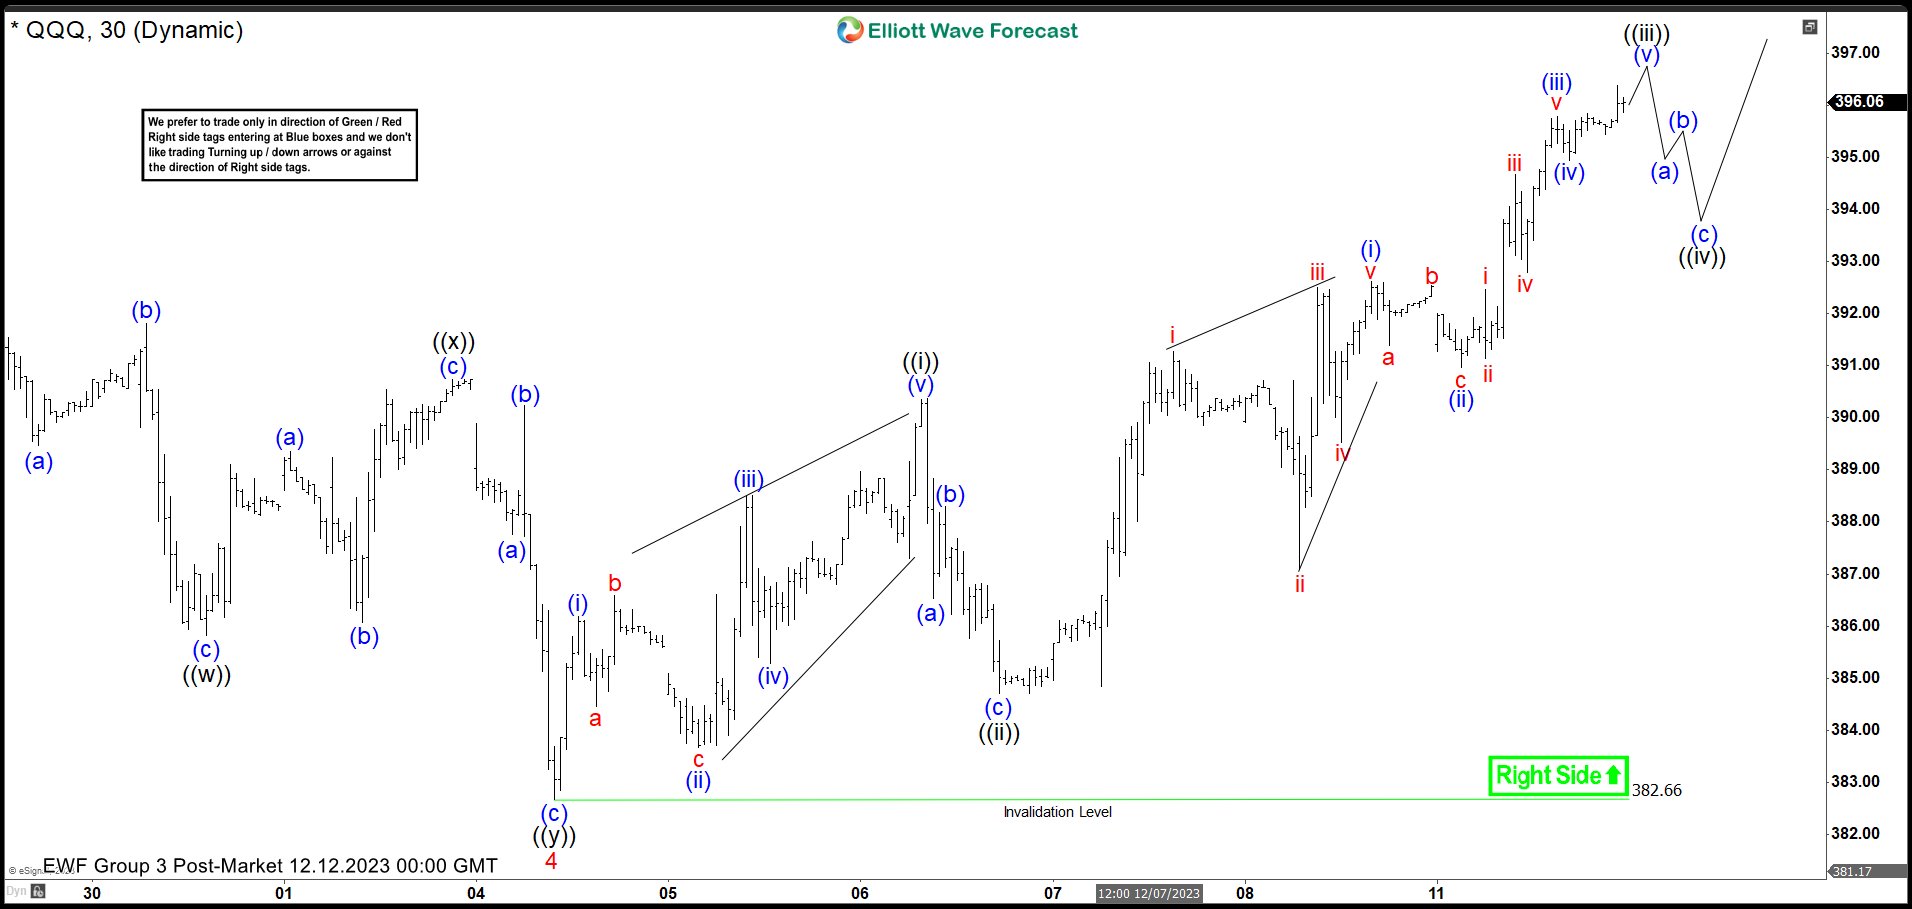
Cycle from 10.26.2023 low in QQQ remains in progress as a 5 waves impulse Elliott Wave structure. Up from 10.26.2023 low, wave 1 ended at 348.84 and pullback in wave 2 ended at 344.08. The ETF then made a strong rally in wave 3 towards 394.14. Pullback in wave 4 ended at 382.66 as a double three Elliott Wave structure. Down from wave 3, wave (a) ended at 389.46, wave (b) ended at 391.82, and wave (c) lower ended at 385.82. This completed wave ((w)). Rally in wave ((x)) ended at 390.74 as a flat structure. Down from wave ((x)), wave (a) ended at 387.75, wave (b) ended at 390.23, and wave (c) ended at 382.66. This completed wave ((y)) of 4. The ETF has turned higher in wave 5. Up from wave 4, wave ((i)) ended at 390.36 as a leading diagonal and pullback in wave ((ii)) ended at 384.70. QQQ rally in wave ((iii)) is now in progress. Up from wave ((ii)) low, wave (i) ended at 392.62 as another leading diagonal and wave (ii) correction completed at 390.96. Then wave (iii) rally ended at 395.79 and pullback in wave (iv) finished at 394.95. Near term, we are looking for one more leg higher to complete wave (v) of ((iii)). Afterwards, expect dips to find support in 3, 7, 11 swing as wave ((iv)) for further upside to complete the impulsive structure from 10.26.2023 low.
QQQ 30 Minutes Elliott Wave Chart
QQQ Elliott Wave Video
The post QQQ Should See Further Upside in Impulsive Rally appeared first on Elliott Wave Forecast : Analysis and Trading Signals.


