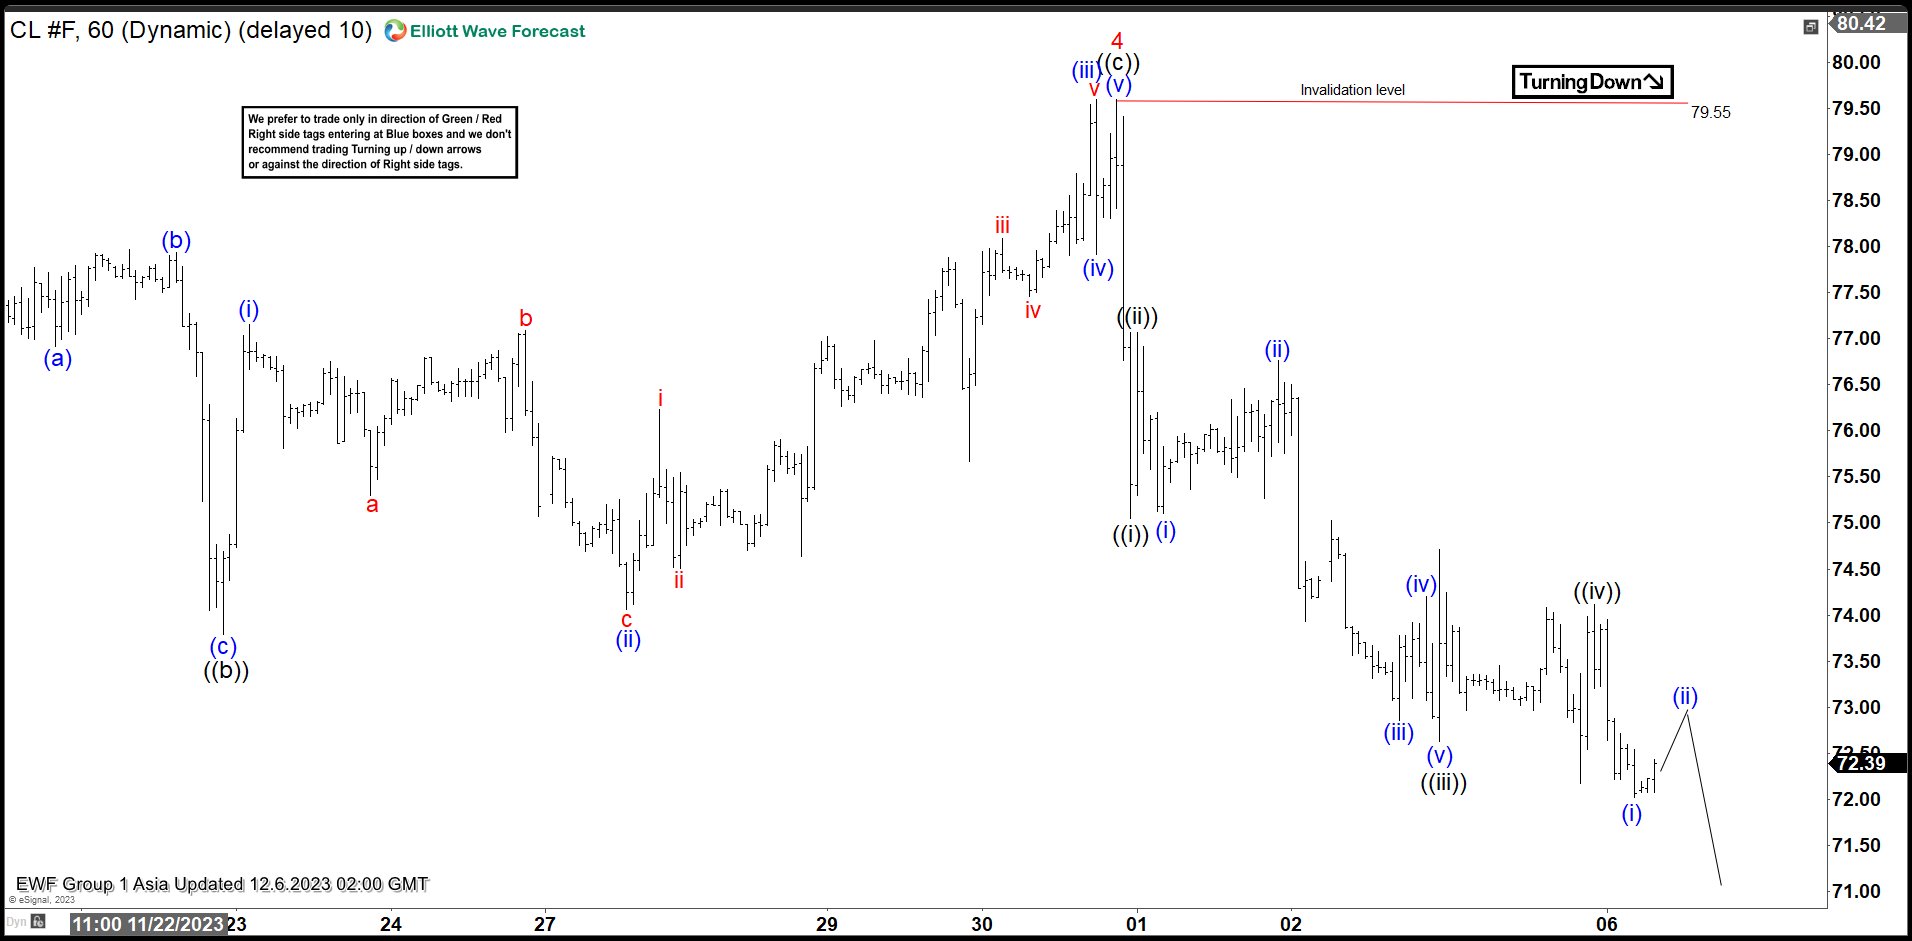
Cycle from 9.28.2023 high in Oil (CL) is in progress as a 5 waves impulse Elliott Wave structure. Down from 9.28.2023 high, wave 1 ended at 81.50 and rally in wave 2 ended at 90.78. Oil then extended lower in wave 3 towards 72.16. Wave 4 at 79.55 as the 1 hour chart below shows. Up from wave 3, wave ((a)) ended at 78.22, and dips in wave ((b)) ended at 73.79. Wave ((c)) higher ended at 79.55 which completed wave 4. Up from wave ((b)), wave (i) ended at 77.15 and wave (ii) ended at 74.06. Wave (iii) ended at 79.6, wave (iv) ended at 77.91, and wave (v) ended at 79.55 which completed wave ((c)) of 4. Oil has turned lower in wave 5. Internal subdivision of wave 5 is unfolding as a 5 waves impulse structure. Down from wave 4, wave ((i)) ended at 75.05 and wave ((ii)) rally ended at 77.07. Oil then turns lower in wave ((iii)). Down from wave ((ii)), wave (i) ended at 75.1 and rally in wave (ii) ended at 76.76. Oil extends lower in wave (iii) towards 72.86, wave (iv) ended at 74.20, and final leg wave (v) ended at 72.63 which completed wave ((iii)). Wave ((iv)) correction ended at 74.12. Expect Oil to extend lower in wave ((v)) of 5. Near term, as far as pivot at 79.55 stays intact, Oil has scope to extend a bit lower to end the 5 waves move before larger 3 waves rally takes place.
Oil Futures (CL_F) 60 Minutes Elliott Wave Chart
CL Elliott Wave Video
The post Oil (CL) Should See at Least 3 Waves Rally Soon appeared first on Elliott Wave Forecast : Analysis and Trading Signals.


