In this blog, we will take a look at the reaction from extreme area in NZDJPY, how buyers appeared in the area as expected and produced a strong reaction higher. We will look at how this area was calculated and also look at the current Elliott wave structure of this Yen cross. We will discuss the current Elliott Wave structure and short-term incomplete sequence that has been created and what it could lead to going forward.
NZDJPY July 27, 4 Hour Elliott Wave Analysis
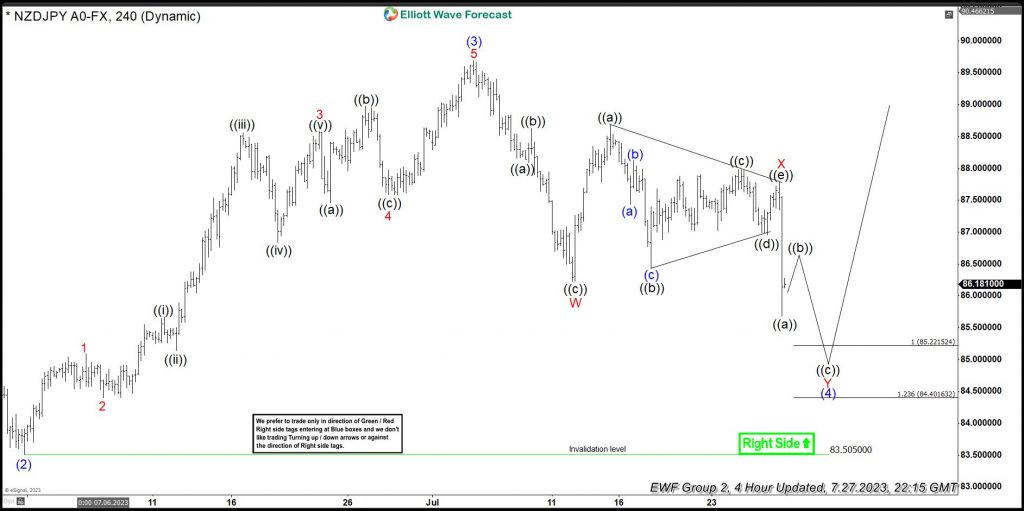
The chart below shows the pair to be in a double three Elliott wave structure with some more downside needed to complete the structure. It shows an extreme area (100 – 123.6 Fibonacci extension) between 85.22 – 84.40 where we expected the correction to end and buyers to appear to resume the rally or produce 3 waves reaction higher at least. 
NZDJPY September 26, Daily Elliott Wave Analysis
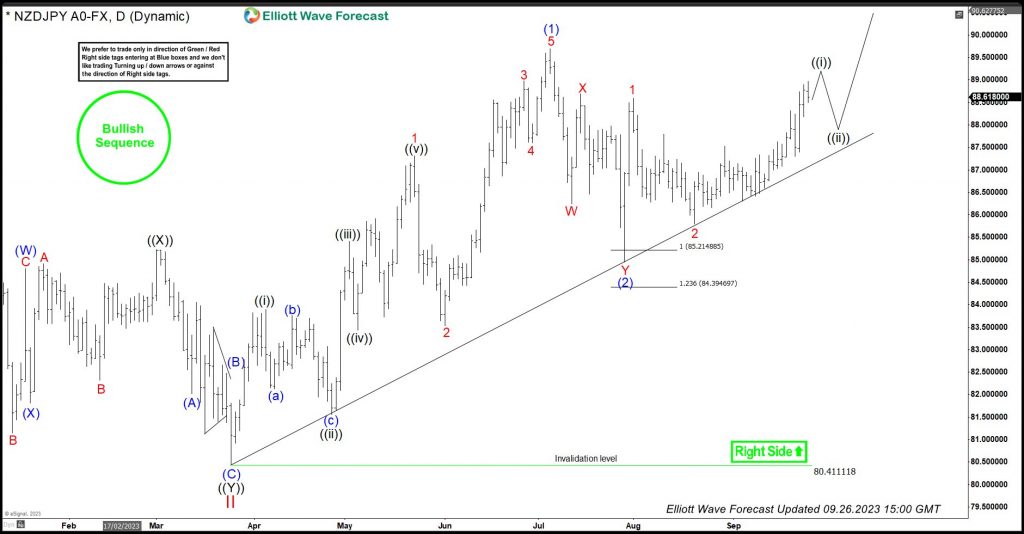
The chart below is a daily chart and shows the pair reached the extreme area between 85.22 – 84.40 and turned higher sharply. It rallied to 88.59 which we have labelled as wave 1 of the new cycle. This was followed by a pullback to 85.79 which we have labeled as wave 2. It started rallying again and it has now broken above 88.59 peak which creates a short-term incomplete sequence higher from 7.28.2023 low against 8.21.2023 low and has a 100 – 161.8% Fibonacci extension target area coming between 89.44 – 91.68.  Blue wave (1) peak was seen on 7.5.2023 @ 89.69, a break of this level will create a larger bullish sequence up from 3.24.2023 low against 7.28.2023 low and confirm further upside in NZDJPY and other Yen crosses with 61.8% Fibonacci extension coming at 90.66 and 100% Fibonacci extension coming at 94.20. We don’t like selling the pair and near-term dips should remain supported in 3, 7 or 11 swings for extension higher toward 89.44. Once 7.5.2023 peak breaks, that will create a 4 hour bullish sequence and offer buying opportunities again in the dips in 3, 7 or 11 swings.
[VIDEO]: NZDJPY Reaction from Extreme Area and Incomplete Sequence
The post NZDJPY Rally from Extreme Area and Bullish Sequence appeared first on Elliott Wave Forecast : Analysis and Trading Signals.


