It doesn’t matter
It don’t bother me
(Well, a little bit now)…
(From “It Don’t Bother Me” by Jack Mack and the Heart Attack, 1990)
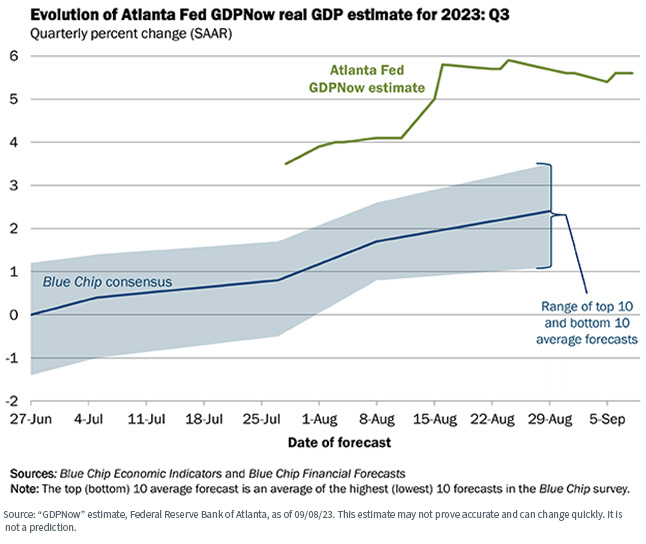
The consensus seems to be shifting to a more optimistic outlook on the economy and the market. The economy has proved more resilient than expected, the Federal Reserve seemingly has reached or is near the end of its rate hike cycle, earnings are expected to improve as we move through the next several quarters, inflation seems to be trending in the right direction (though is still higher than the Fed target of 2%, annualized), and both the stock and bond markets seem calm.
Look, for example, at the current Atlanta Fed GDPNow forecast, which, as of September 8, was suggesting 5.6% GDP growth in the third quarter.
So, what is there to be “bothered” about? Well, to me, “a little bit now.” While the headline numbers seem reasonably positive, other indicators suggest there may be more fragility than indicated in the current consensus outlook.
Let’s take a look.
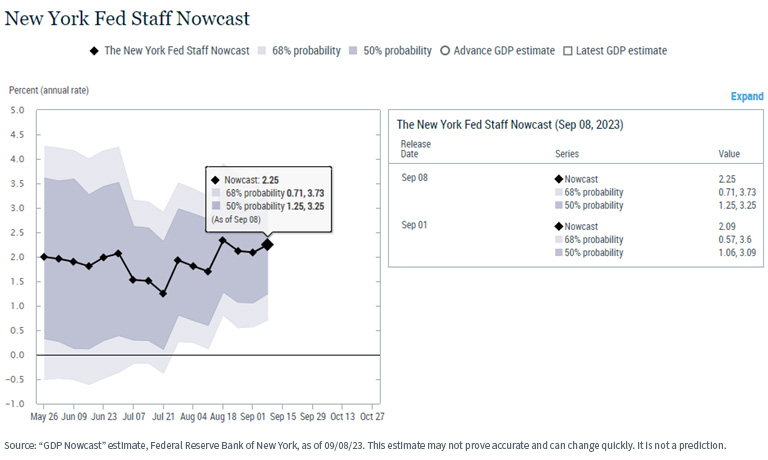
Other Federal Reserve banks are much less sanguine
The recently reinstated “GDP Nowcast” from the New York Fed currently registers a still positive but much lower 2.25% GDP growth for the third quarter.
Meanwhile, the St. Louis Fed is downright curmudgeonly, and currently is estimating a negative 0.25% GDP growth rate for the quarter.
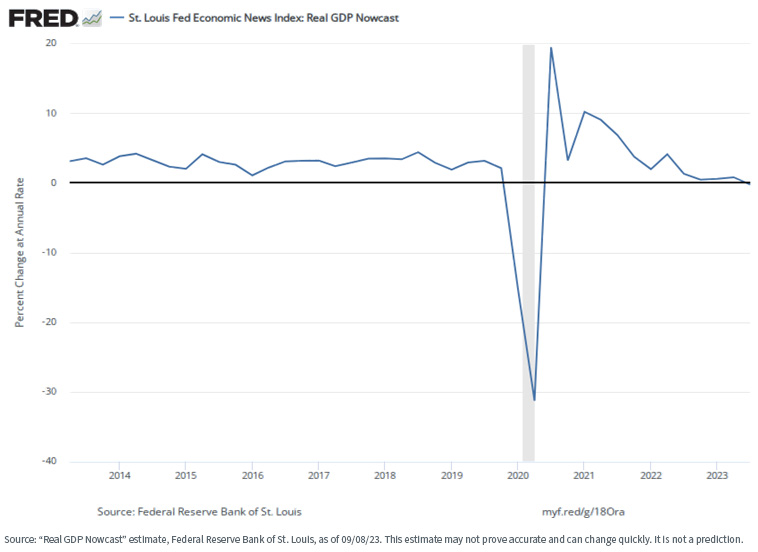
All these Fed banks use different measurements for their estimates, and it is not unusual to see dispersion between them. Nor have any of them proven to be especially accurate over time. But the wide discrepancies of their respective current estimates suggest there is more uncertainty regarding the economy than many seem to believe.
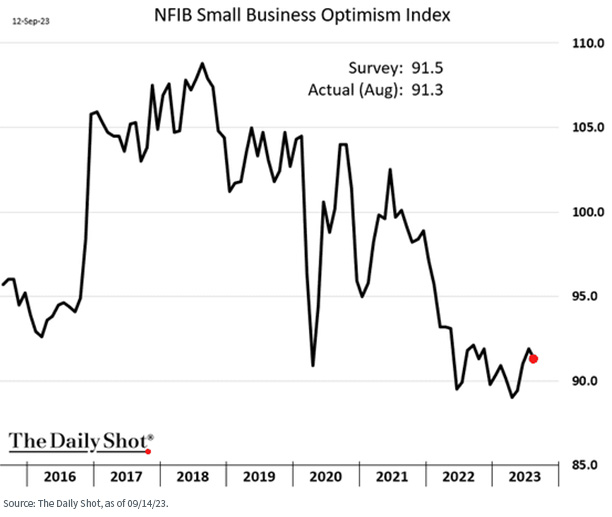
Small Business Owners Are Decreasingly Optimistic
Small businesses (generally defined as firms with fewer than 500 employees) employ roughly 50% of all U.S. workers, so how they see the economy is something to pay attention to.
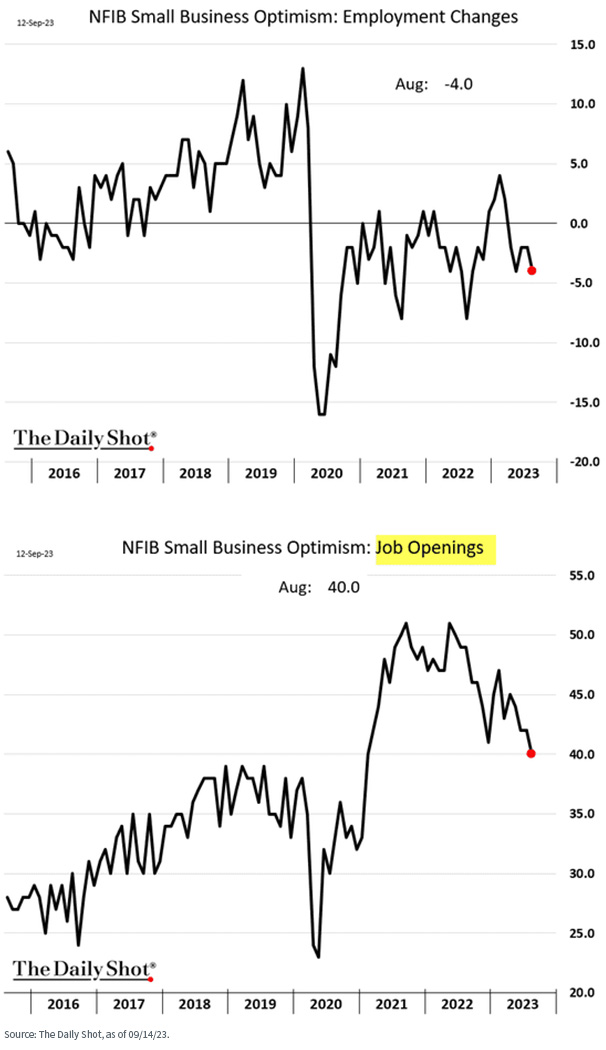
Recent survey results are trending in the wrong direction. The three following charts are sourced from the NFIB (National Federation of Independent Businesses), through the end of August.
Overall optimism is down.
Sales are down.
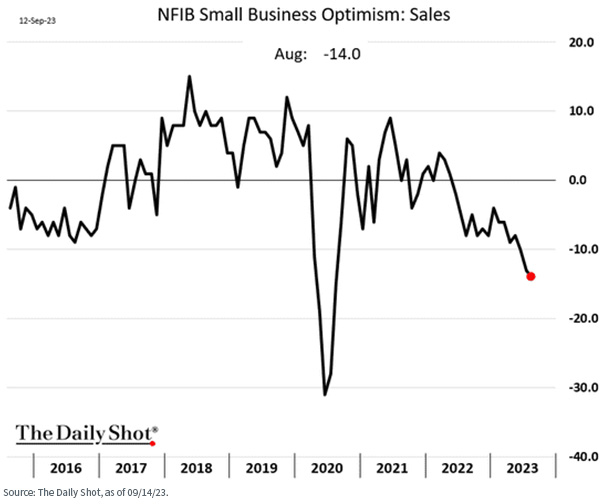
And hiring is down.
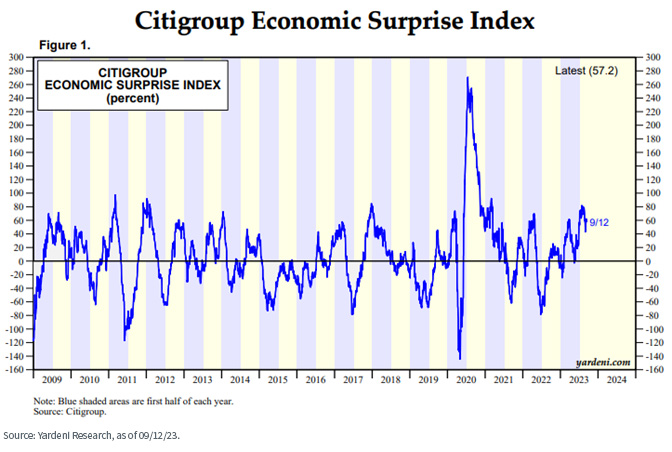
Other Indicators
Other indicators also seem to be trending in the wrong direction. The Citigroup Economic Surprise Index measures how forecasted economic measurements compare to the actual hard numbers when they come in. If the index is moving up, it means the actual numbers are coming in above forecasts. If the index is moving down, it means the data are coming in weaker than forecasted.
This index tends to be “mean reverting” so while the absolute level is relevant, what we focus on is the trend (i.e., which direction the index is moving). Currently, the index suggests the data are starting to come in worse than expected.
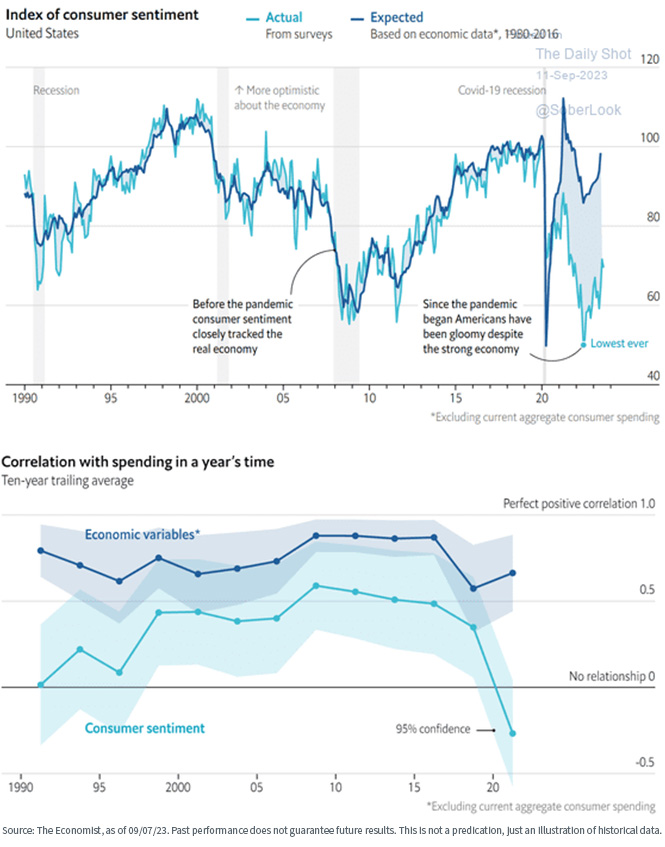
Another interesting indicator is consumer sentiment, since consumption drives such a large part of the U.S. economy.
Here we see an interesting disconnect. The following chart is a visualization between “hard vs. soft” economic data. Hard data is the actual numbers on quantitatively measurable metrics. Soft data is a variety of consumer sentiment indicators.
We currently are witnessing an historically wide dispersion between the “hard” data and consumer sentiment (though the gap is closing). Why does this matter? Because sentiment (or confidence) influences consumption, as can be seen in the bottom chart below.
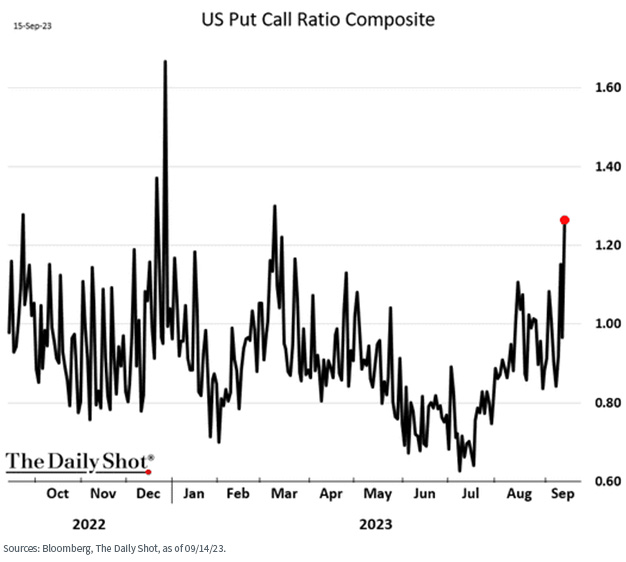
Another angle on sentiment is investor sentiment, and one commonly reference metric here is the “put/call” ratio. That is, how many investors are buying equity market put options (a bearish signal) versus call options (a bullish signal).
Based on this ratio, we see decreasing optimism regarding the future direction of the stock market.
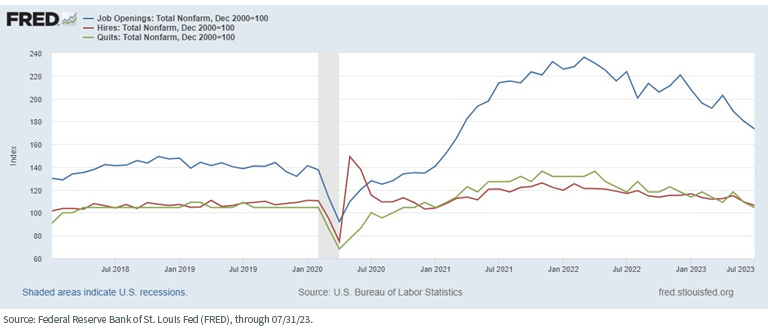
Finally, let’s look at the labor market. The headline numbers (unemployment rate, jobless claims, etc.) are proving to be resilient and collectively are one of the base arguments for (a) a general view that the economy is doing ok, and (b) why the Fed maintains its tighter rate policy.
But look at some of the “numbers behind the numbers.” Job openings, the “hires” rate, and the “quits” rate are all declining. Job openings and hires are self-explanatory, but the quits rate warrants an explanation.
When the quits rate is rising, it suggests that workers are more comfortable leaving their current jobs because they are more confident they can find another one. Conversely, when the quits rate declines it suggests they are less optimistic about finding another job, and so choose to remain in the one they have.
Why does this matter? From a top line view, the data suggests that jobs are becoming scarcer. At a more nuanced level, a declining quits rate suggests that workers are becoming more cautious, which may translate into their consumption habits.
Conclusions
The song cited at the beginning of this post captures nicely a certain economic scenario—“It don’t bother me (well, a little bit now).”
I am not suggesting the sky is falling—conversely, I think we will hold off recession in 2023, though we may find ourselves in one at some point in 2024.
But I get nervous when everyone leans in the same direction—in this case, that we are in for a “soft landing” or may avoid recession altogether. That may prove to be true, but I think there is more fragility in the economy than the headline numbers suggest.
To quote another song, this time from Billy Joel, “You may be right/I may be crazy,” but I think examining the “numbers behind the numbers” is always a worthwhile exercise.
]]>
