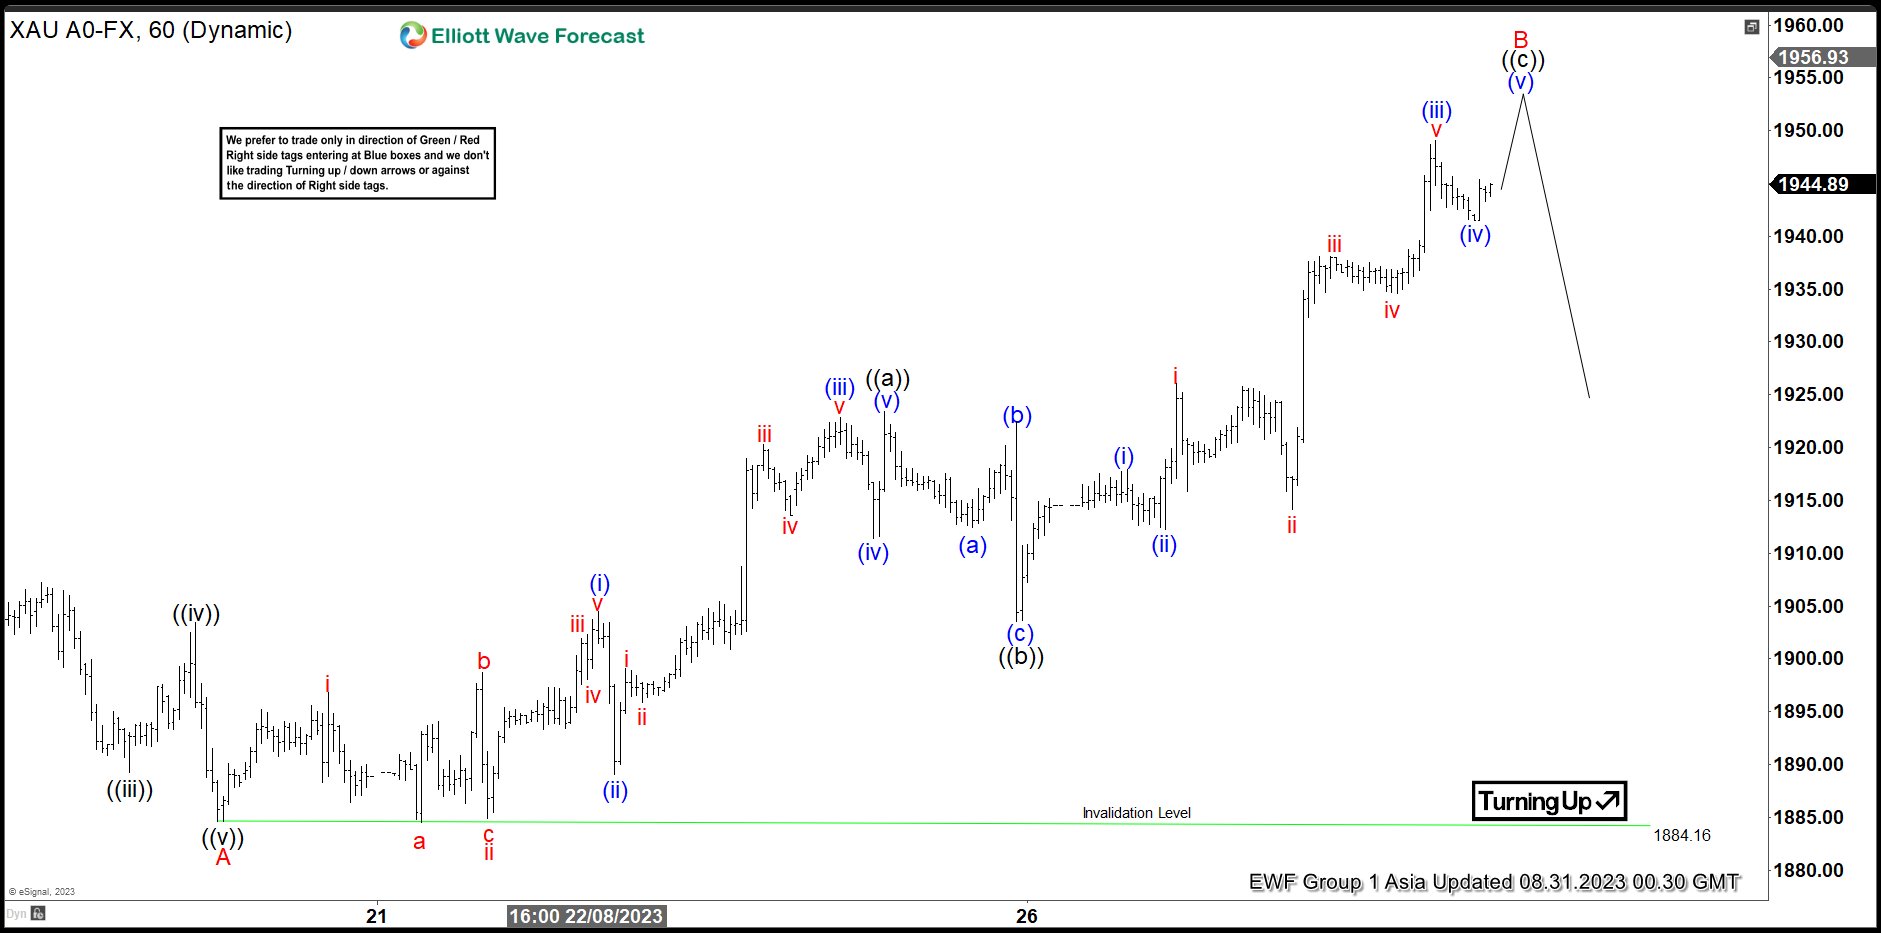
Short Term Elliott Wave structure in Gold (XAUUSD) suggests the drop in Gold on August ended wave A at 1884.16 low. The metal now is extending higher in 3 swings to end a wave B correction. Up from 8.17.2023 low, wave (i) ended at 1904.50 and wave (ii) pullback ended at 1889.02. Rally from wave (ii), wave (iii) ended at 1922.89 and wave (iv) correction ended at 1911.40. Last push to complete wave (v) and the first leg of wave B as wave ((a)) ended at 1923.37. From here, the metal extended lower in 3 swing towards 1903.50 which ended wave ((b)) of B as a zigzag corrective structure. The metal then rallied again in wave ((c)). Up from 1903.50 low, wave (i) finish at 1914.90 and wave (ii) retracement completed at 1912.20. Then, gold had a nice rally to end wave (iii) at 1949.05 and wave (iv) correction ended at 1941.45 . Currently, XAUUSD is expecting to trade to the upside to break wave (iii) high and end the last leg as wave (v) of ((c)) of B. Once the wave B is completed, we expect a reaction to continue to the downside or see 3 swings lower at least.
Gold 60 Minutes Elliott Wave Chart
Gold Elliott Wave Video
The post Gold (XAUUSD) Is at Area Where It Can Pullback appeared first on Elliott Wave Forecast : Analysis and Trading Signals.


