
Hello everyone. In today’s article, we will look at the past performance of the 1 Hour Elliott Wave chart of General Electric Co. ($GE). The rally from 10.23.2023 low unfolded as a 5 wave impulse. So, we expected the pullback to unfold in 7 swings and find buyers again. We will explain the structure & forecast below:
$GE 1H Elliott Wave Chart 12.07.2023:
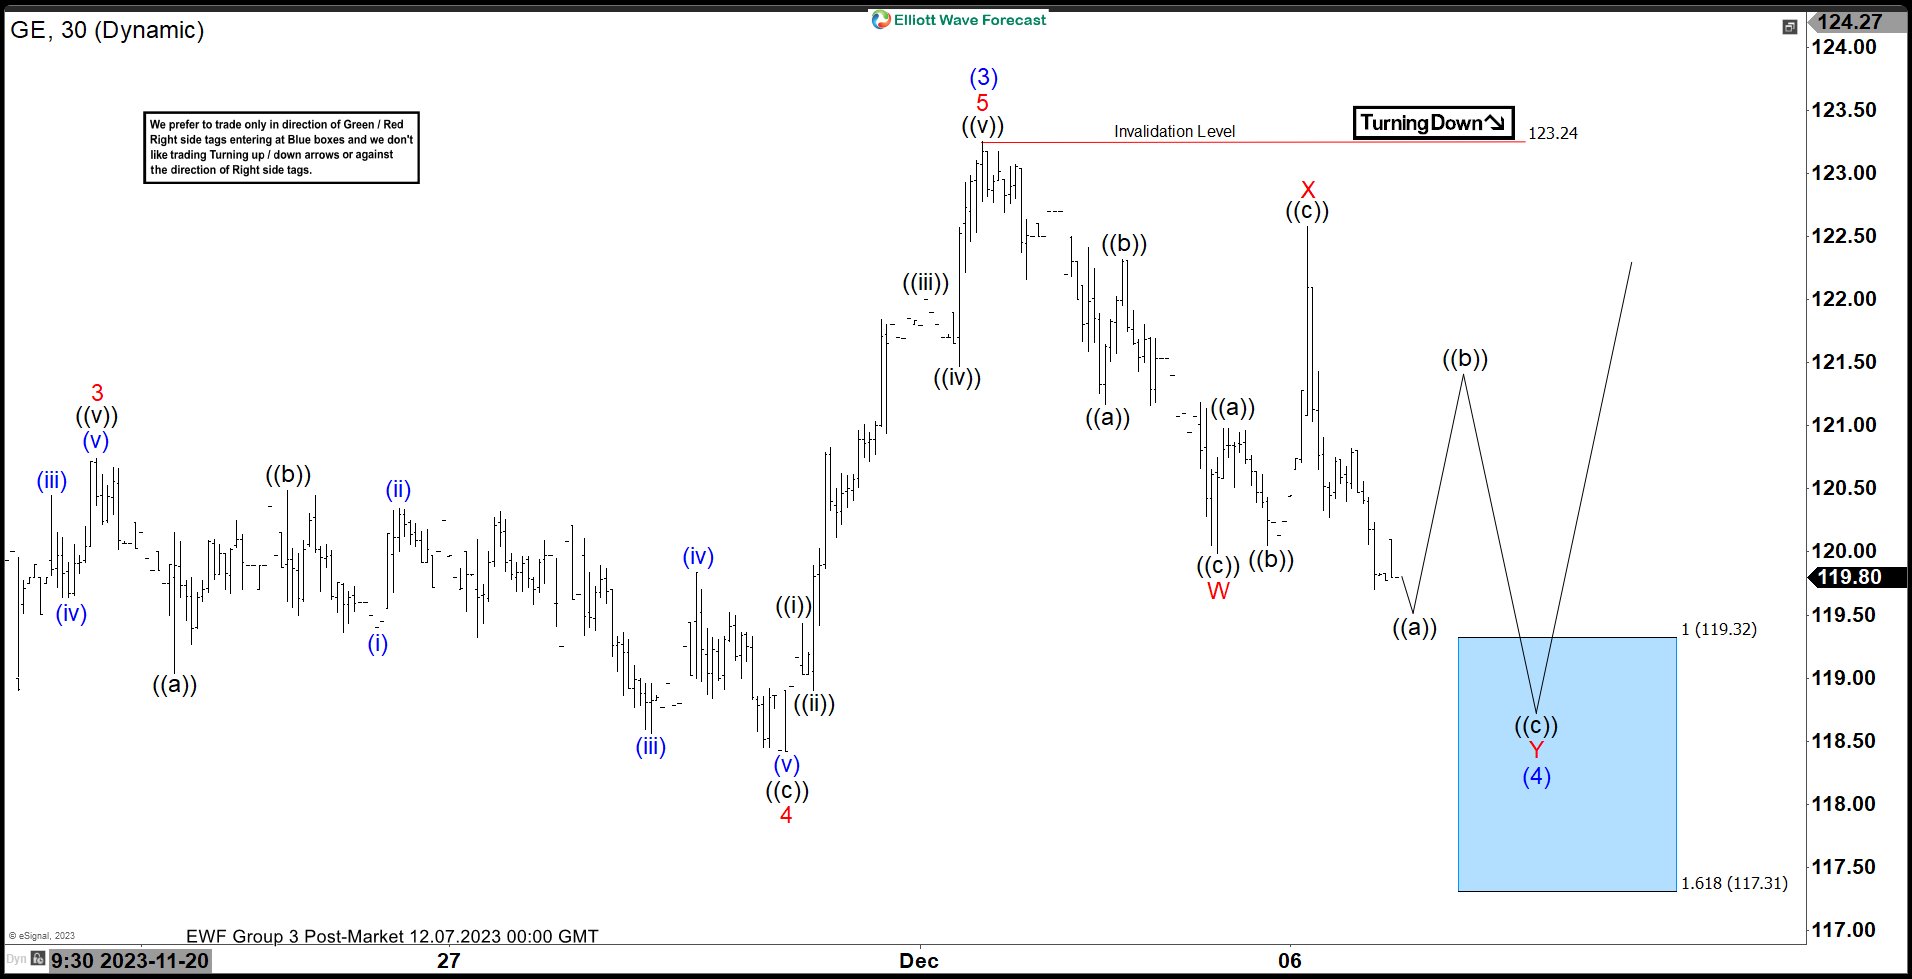 Here is the 1H Elliott Wave count from 12.07.2023. The rally from 10.23.2023 peaked at blue (3) and started a pullback to correct it. We expected the pullback to find buyers at (4) in 7 swings (WXY) at $119.32 – 117.31.
$GE 1H Elliott Wave Chart 12.10.2023:
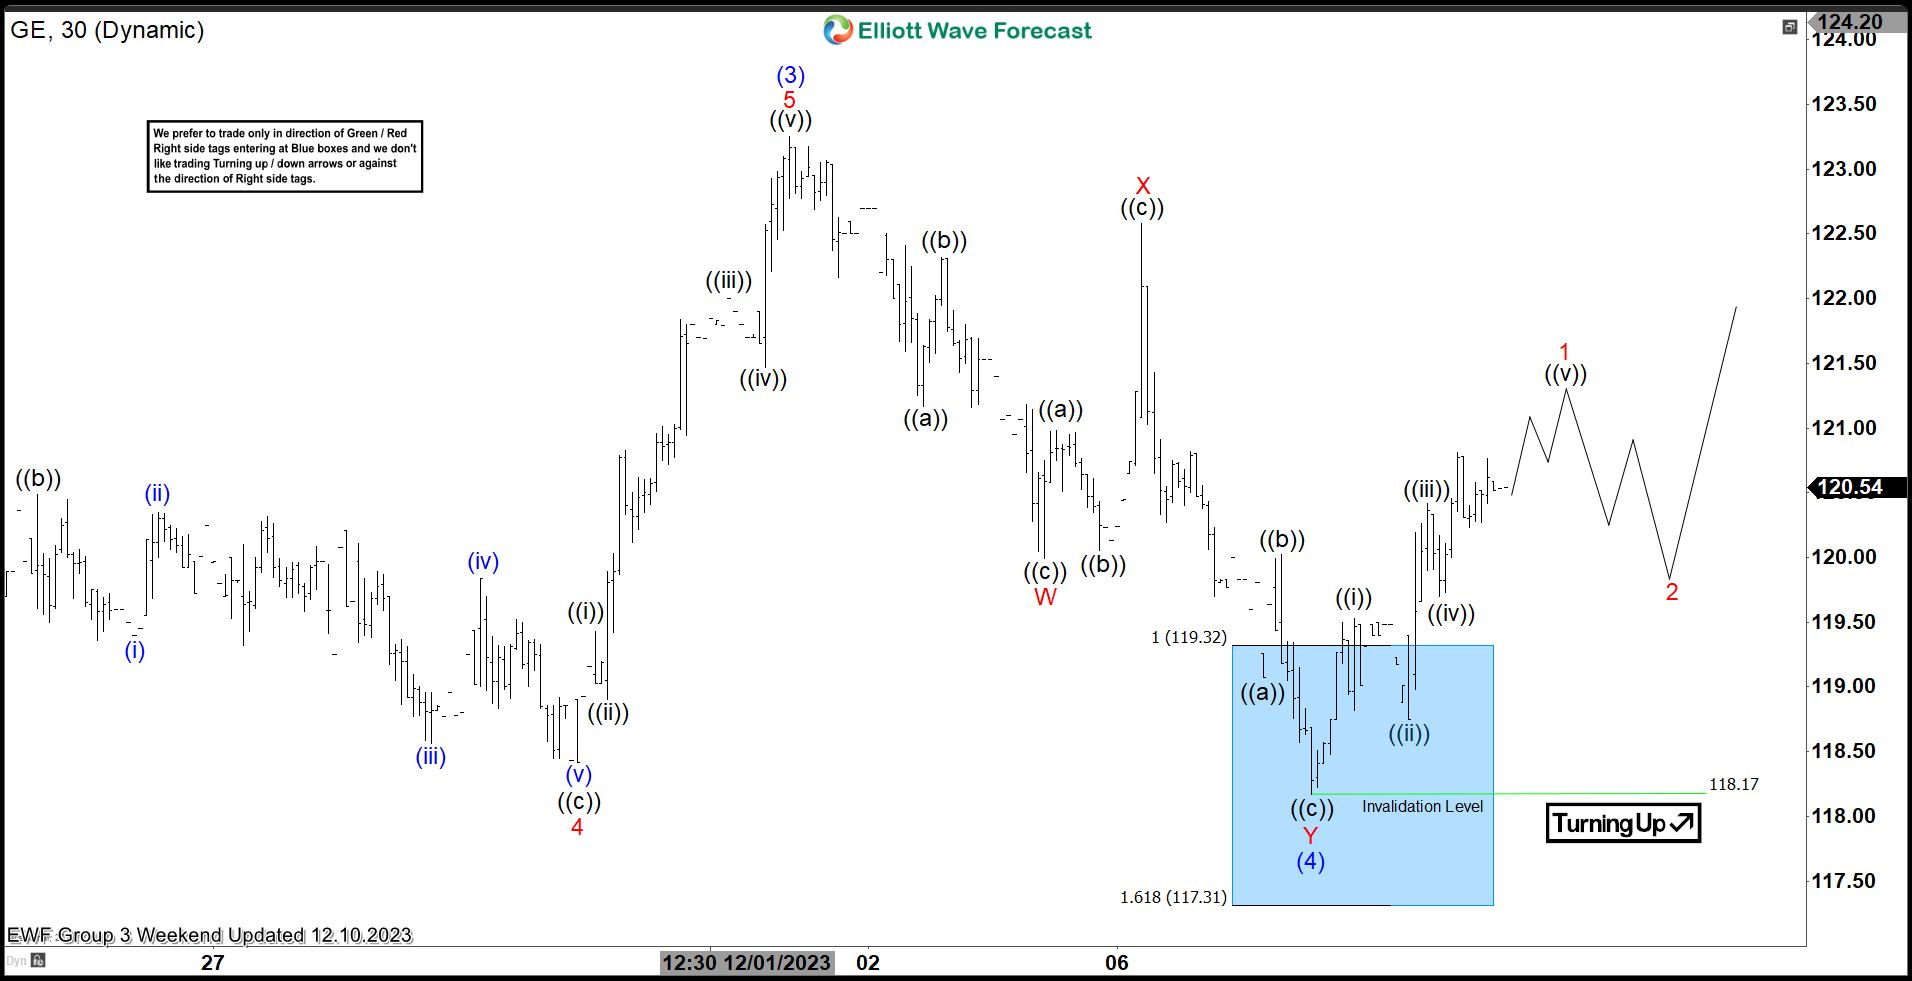 Here is the 1H update from 12.10.2023 showing the bounce taking place as expected. The stock bottomed at $118.17 and reacted higher after reaching the blue box area allowing longs to get a risk free position. We expect the stock to continue higher in wave (5) towards $124 – 126 before a pullback can happen.
Elliott Wave Forecast
We cover 78 instruments, but not every chart is a trading recommendation. We present Official Trading Recommendations in the Live Trading Room. If not a member yet, Sign Up for Free 14 days Trial now and get access to new trading opportunities. Welcome to Elliott Wave Forecast!
The post General Electric Co. ($GE) Blue Box Area Wins Again. What’s Next? appeared first on Elliott Wave Forecast : Analysis and Trading Signals.
