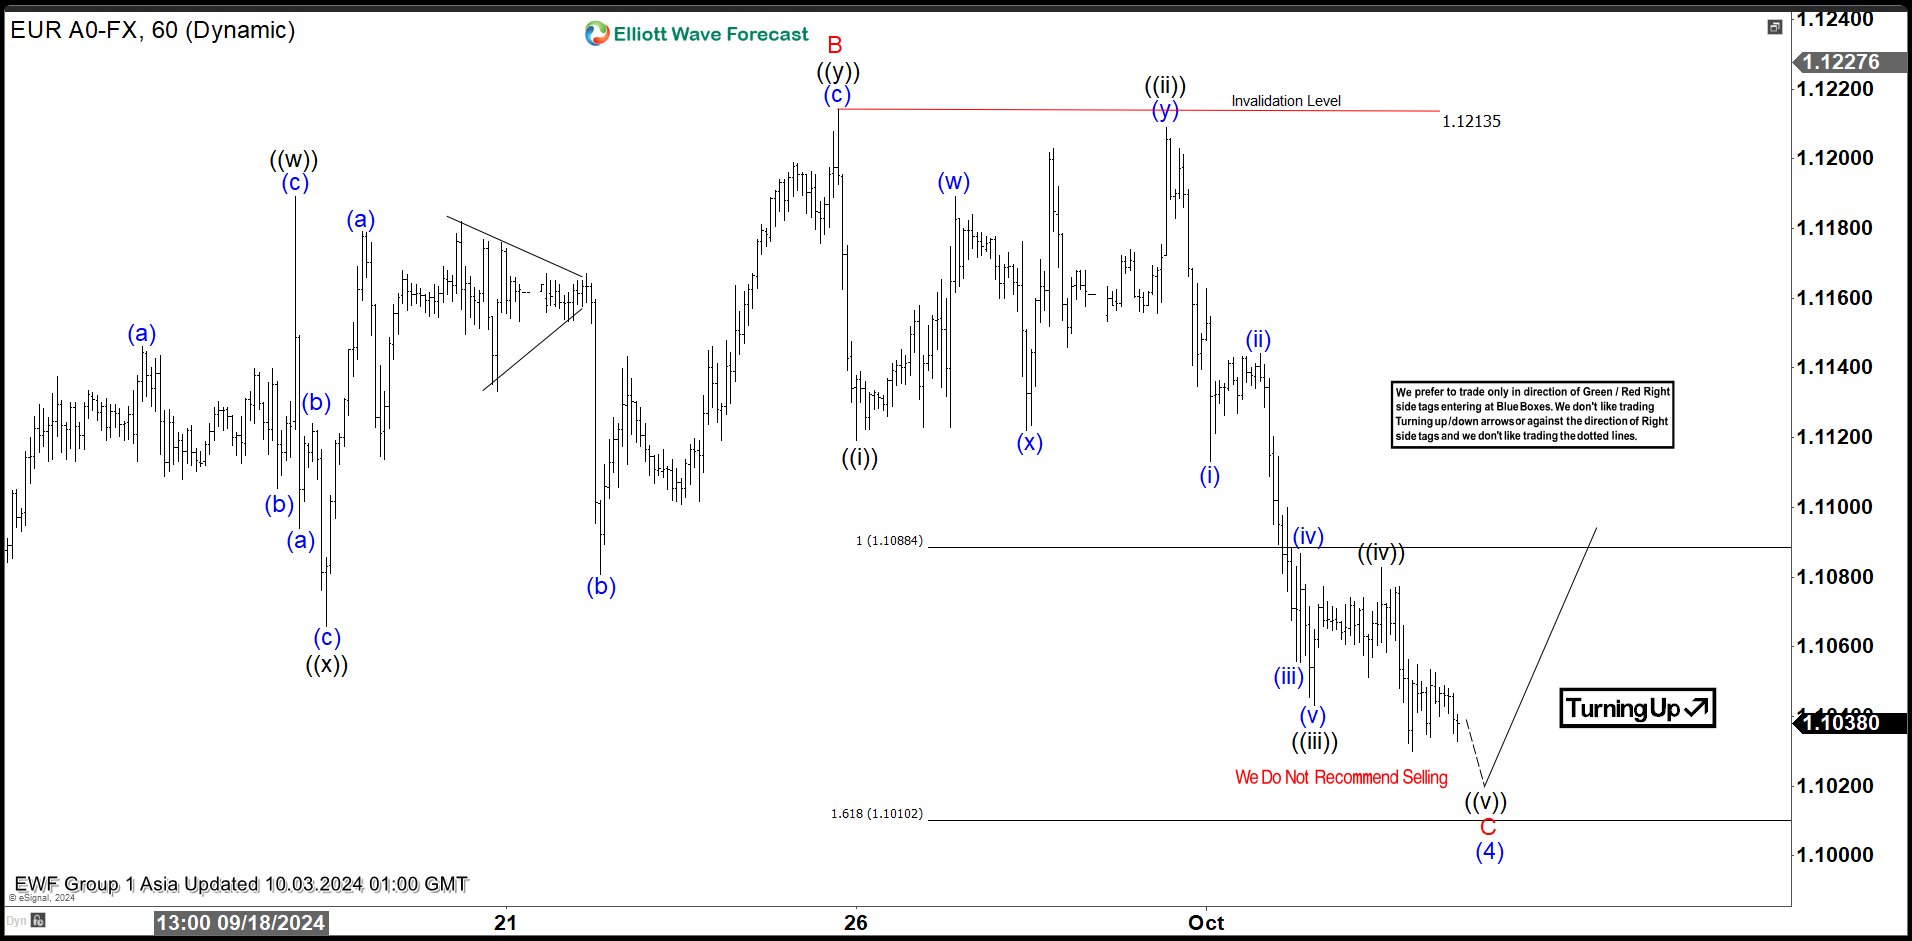
Short Term Elliott Wave View in EURUSD suggests that cycle from 4.16.2024 low is in progress as a 5 waves impulsive Elliott Wave structure. Rally to 1.12 ended wave (3) of the impulse. Pullback in wave (4) is now in progress with internal subdivision as an expanded Flat structure. Down from 8.26.2024 high, wave A ended at 1.10. Rally in wave B unfolded as a double three Elliott Wave structure. Up from wave A, wave ((w)) ended at 1.1189 and pullback in wave ((x)) ended at 1.1065. Wave ((y)) higher ended at 1.1213 which completed wave B. The pair turned lower in wave C with subdivision as a 5 waves impulse. Down from wave B, wave ((i)) ended at 1.1119 and rally in wave ((ii)) ended at 1.1209. Internal subdivision of wave ((ii)) unfolded as a double three where wave (w) ended at 1.1189 and wave (x) ended at 1.1122. Wave (y) higher ended at 1.1209 which completed wave ((ii)). Pair resumed lower in wave ((iii)) towards 1.1043 and wave ((iv)) ended at 1.1082. Expect wave ((v)) of C of (4) to complete soon and pair to turn higher in 3 waves at least.
EURUSD 60 Minutes Elliott Wave Chart
EURUSD Elliott Wave Video
The post EURUSD Looking for Expanded Flat Elliott Wave Correction appeared first on Elliott wave Forecast.


