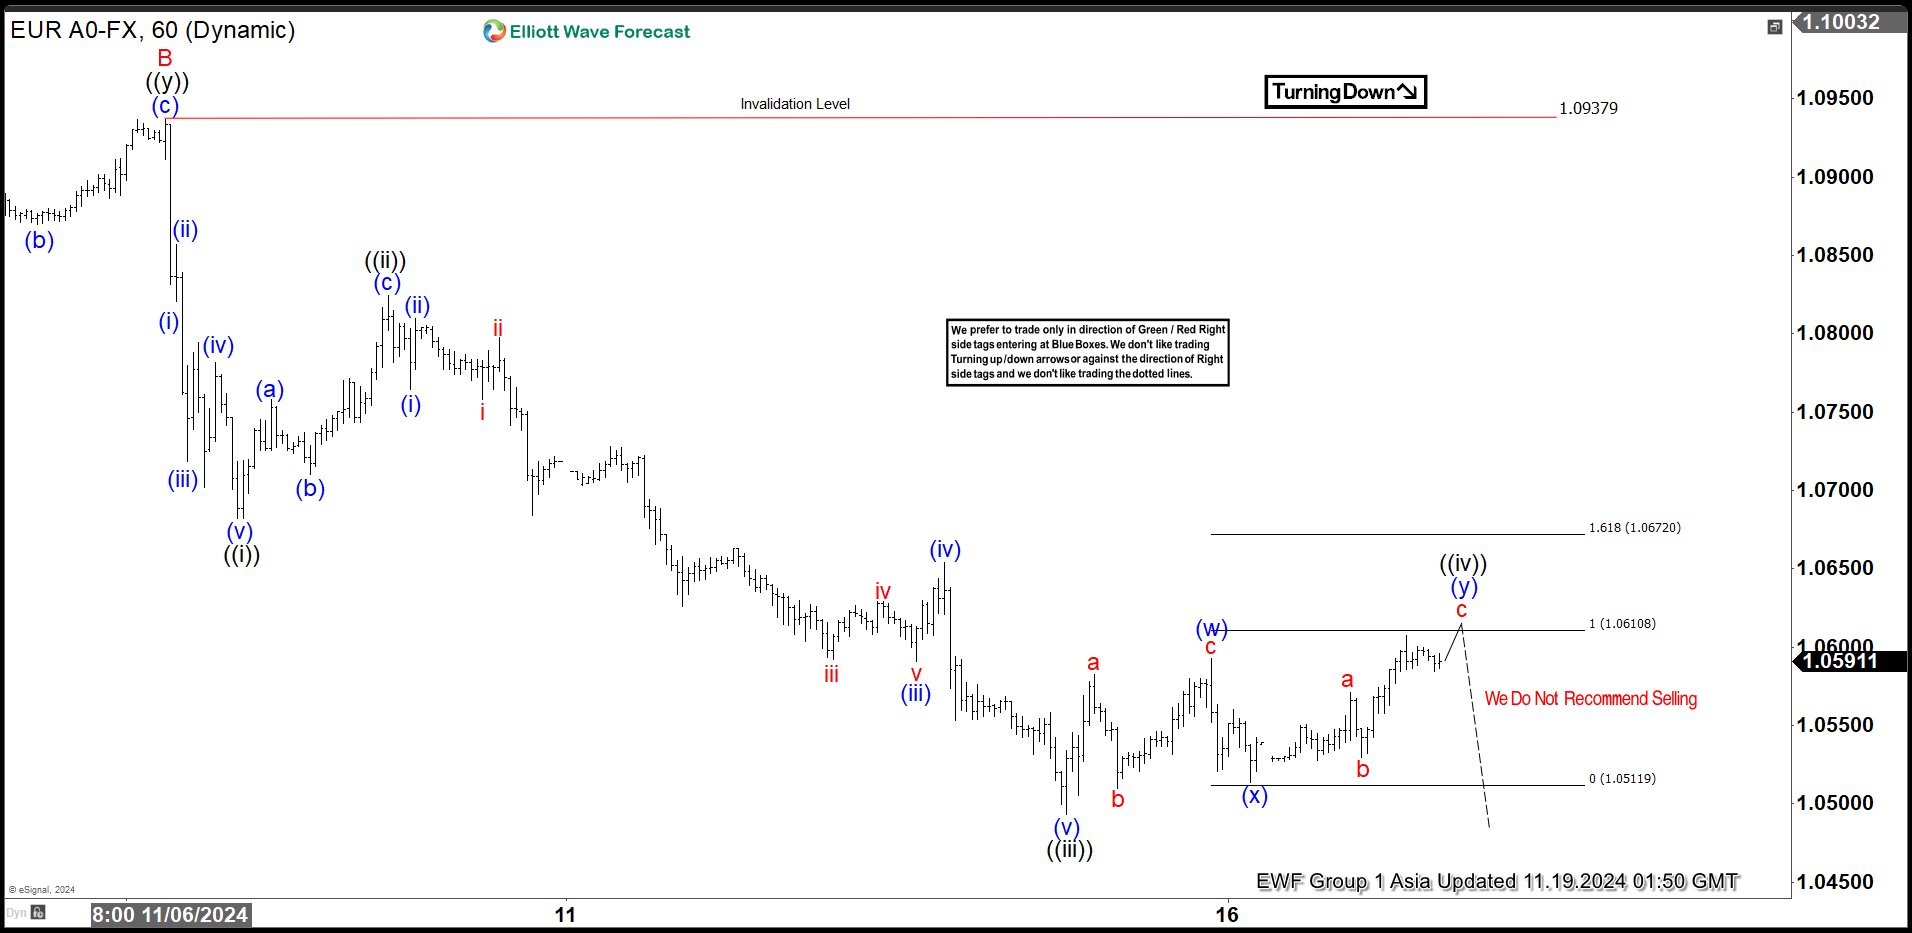
Short Term Elliott Wave View in EURUSD suggests cycle from 9.25.2024 high is in progress as a zigzag. Down from 9.25.2024 high, wave A ended at 1.076 and wave B rally ended at 1.09369. Wave C lower is in progress as a 5 waves impulse Elliott Wave structure. Down from 11.6.2024 high, wave (i) ended at 1.082 and wave (ii) rally ended at 1.0857. Wave (iii) lower ended at 1.0718 and wave (iv) ended at 1.078. Wave (v) lower ended at 1.0682 which completed wave ((i)) in higher degree. Rally in wave ((ii)) ended at 1.0825 with internal subdivision as a zigzag. Pair then turned lower in wave ((iii)). Down from wave ((ii)), wave (i) ended at 1.076 and rally in wave (ii) ended at 1.0809. Pair resumed lower in wave (iii) towards 1.059 and rally in wave (iv) ended at 1.0654. Pair extended lower 1 more time in wave (v) towards 1.0493 which completed wave ((iii)) in higher degree. Wave ((iv)) is in progress as a double three Elliott Wave structure. Up from wave ((iii)), wave (w) ended at 1.0593 and pullback in wave (x) ended at 1.0513. Expect wave (y) higher to complete at 1.061 – 1.067 area and this should complete wave ((iv)) in higher degree. From there, expect the pair to extend lower.
EURUSD 60 Minutes Elliott Wave Chart
EURUSD Elliott Wave Video
The post Elliott Wave View Looking Further Downside in EURUSD appeared first on Elliott wave Forecast.


