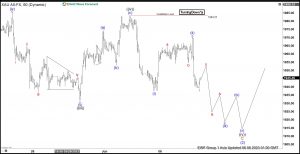
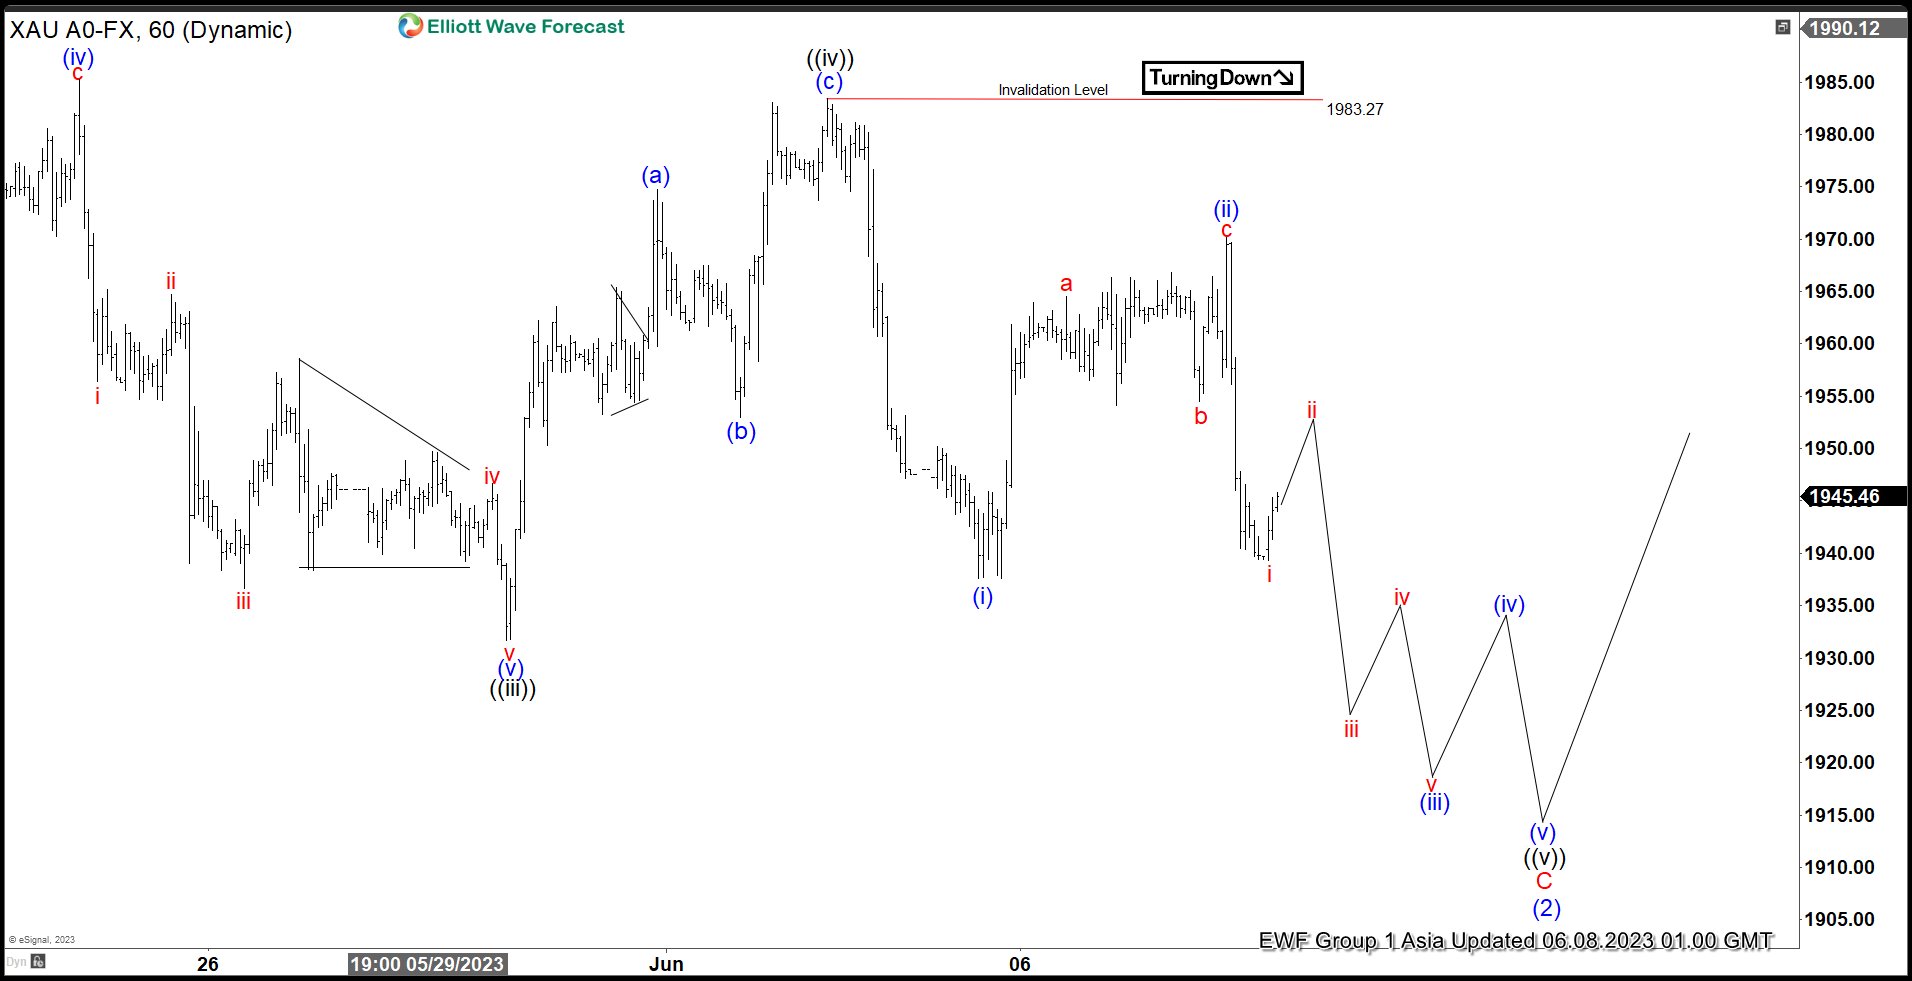
Cycle from 5.4.2023 high in Gold is in progress as a 5 waves impulse. Down from 5.4.2023 high, wave ((i)) ended at 1999.30 and rally in wave ((ii)) ended at 2048.15. The metal then extends lower again in wave ((iii)) towards 1931.70 and wave ((iv)) ended at 1983.27. Internal subdivision of wave ((iv)) unfolded as a zigzag Elliott Wave structure. Up from wave ((iii)), wave (a) ended at 1974.75, pullback in wave (b) ended at 1953, and wave (c) higher ended at 1983.27. This completed wave ((iv)) in higher degree. The metal has extended lower in wave ((v)). Internal subdivision of wave ((v)) is unfolding as a 5 waves impulse Elliott Wave structure. Down from wave ((iv)), wave (i) ended at 1937.6 and rally in wave (ii) ended at 1970.15. Internal subdivision of wave (ii) unfolded as a zigzag. Up from wave (i), wave a ended at 1964.56, pullback in wave b ended at 1954.5, and wave c ended at 1970.15. This completed wave (ii) in higher degree. Gold resumes lower in wave (iii). Down from wave (ii), wave i ended at 1939.30. Expect the metal to rally in wave ii, then resumes lower again. Near term, as far as pivot at 1983.27 high stays intact, Gold has scope to extend lower to end wave ((v)) of C of (2) before the metal turns higher.
Gold (XAUUSD) 1 Hour Elliott Wave Chart
XAUUSD Elliott Wave Video
The post Elliott Wave View: Gold (XAUUSD) Looking to End Wave 5 appeared first on Elliott Wave Forecast : Analysis and Trading Signals.


