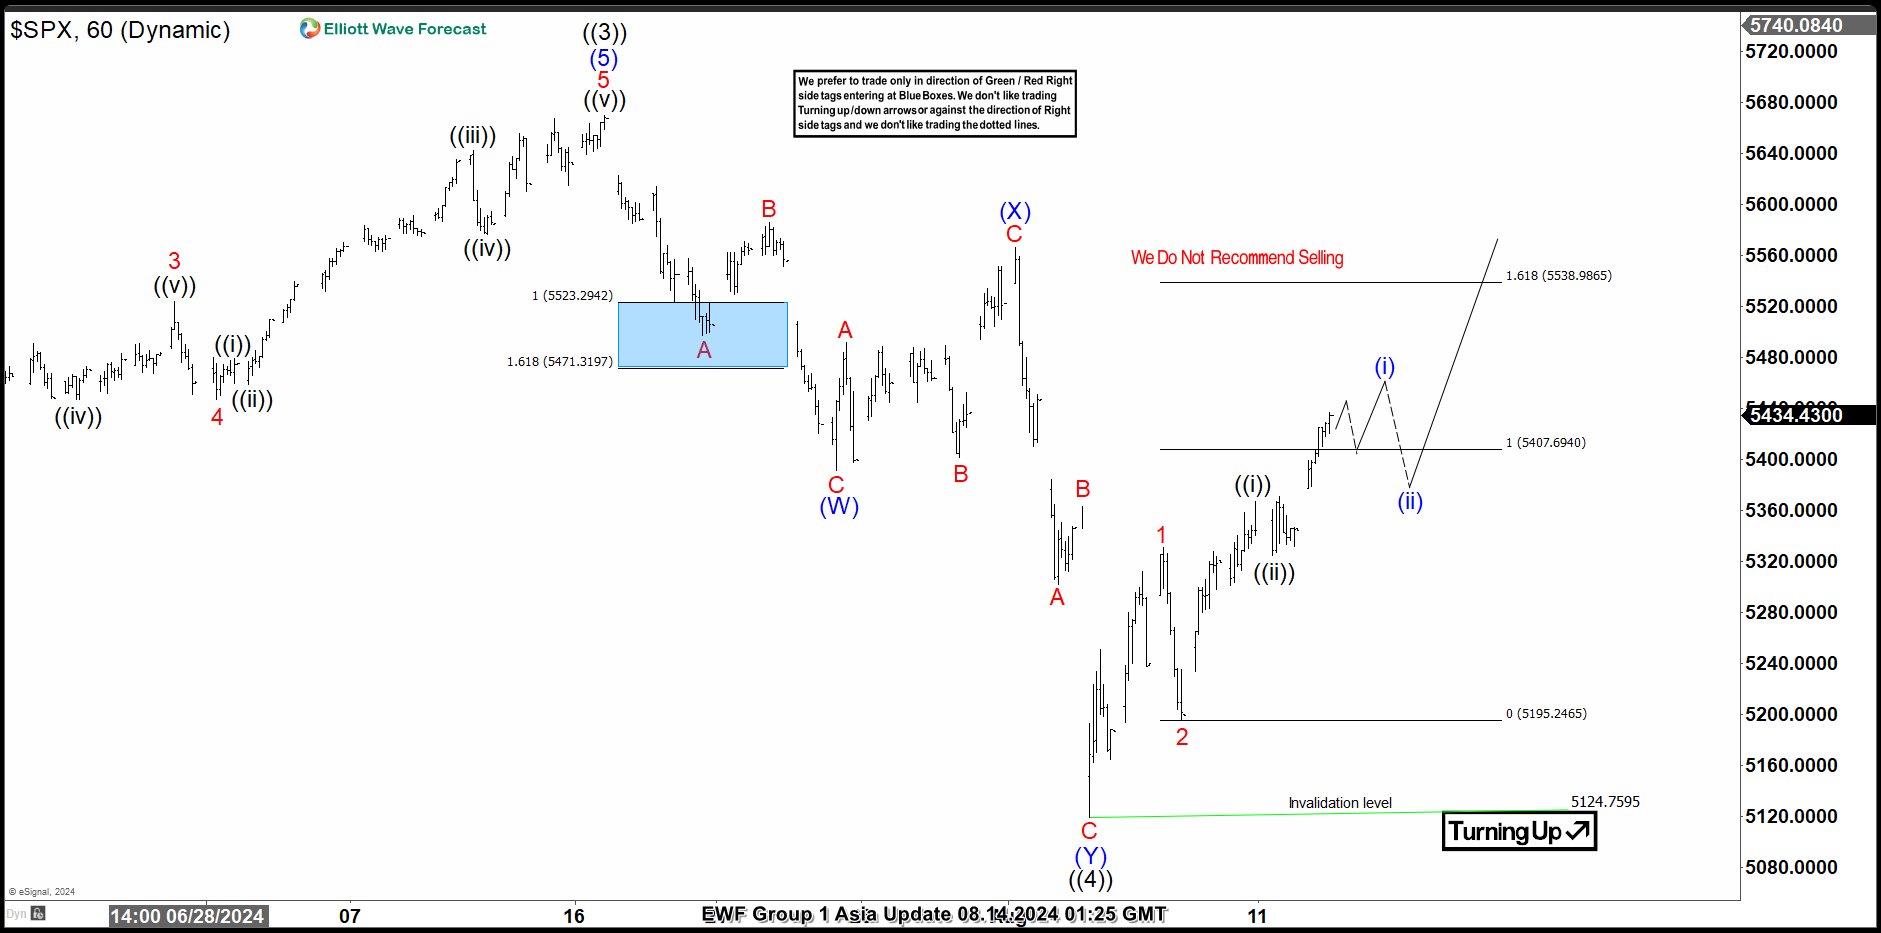
Short Term Elliott Wave View in SPX suggests the trend should continue higher within the sequence started from March 2023 low as the part of daily sequence. It favors upside in wave ((5)) while dips remain above 5124.76 low. Since March 2024 high of (3), it starts a correction as wave (4) ending in April at 4953.56 low and bounced again. The market resumed the rally building an impulse as wave (5) ended at 5669.67 high and also wave ((3)) in higher degree. SPX begins a large retracement in July 16 high. Down from wave ((3)), the index dropped developing a double correction structure. First leg lower, built a zig zag correction to complete a wave (W) at 5390.95 low. Then, the market did a flat structure higher as wave (X) ended at 5566.16 high. The index resumed to the downside forming another zig zag as wave (Y) of ((4)). The cycle was completed at 5119.26 low and also wave ((4)). Actually, SPX has continued higher trading in wave (1) of ((5)). The wave 1 of (1) ended at 5330.64 high and wave 2 of (1) finished at 5195.54 low. The wave 3 of (1) started and we are expecting more upside. While price action stays above 5119.26 low, we are calling for more upside to continue the rally as wave ((5)).
SPX 60 Minutes Elliott Wave Chart
SPX Elliott Wave Video
The post Elliott Wave Intraday Analysis: SPX Resumed the Rally appeared first on Elliott wave Forecast.


