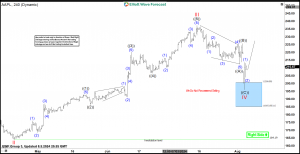
In this technical article we’re going to take a quick look at the weekly Elliott Wave charts of Apple Stock (AAPL) , published in members area of the website. As many of our members are aware, the stock has given us good buying opportunities recently. AAPL hit our buying zone and completed a correction at the Equal Legs (Blue Box Area). In the following sections, we’ll delve into the Elliott Wave pattern and our trading setup for further insight.
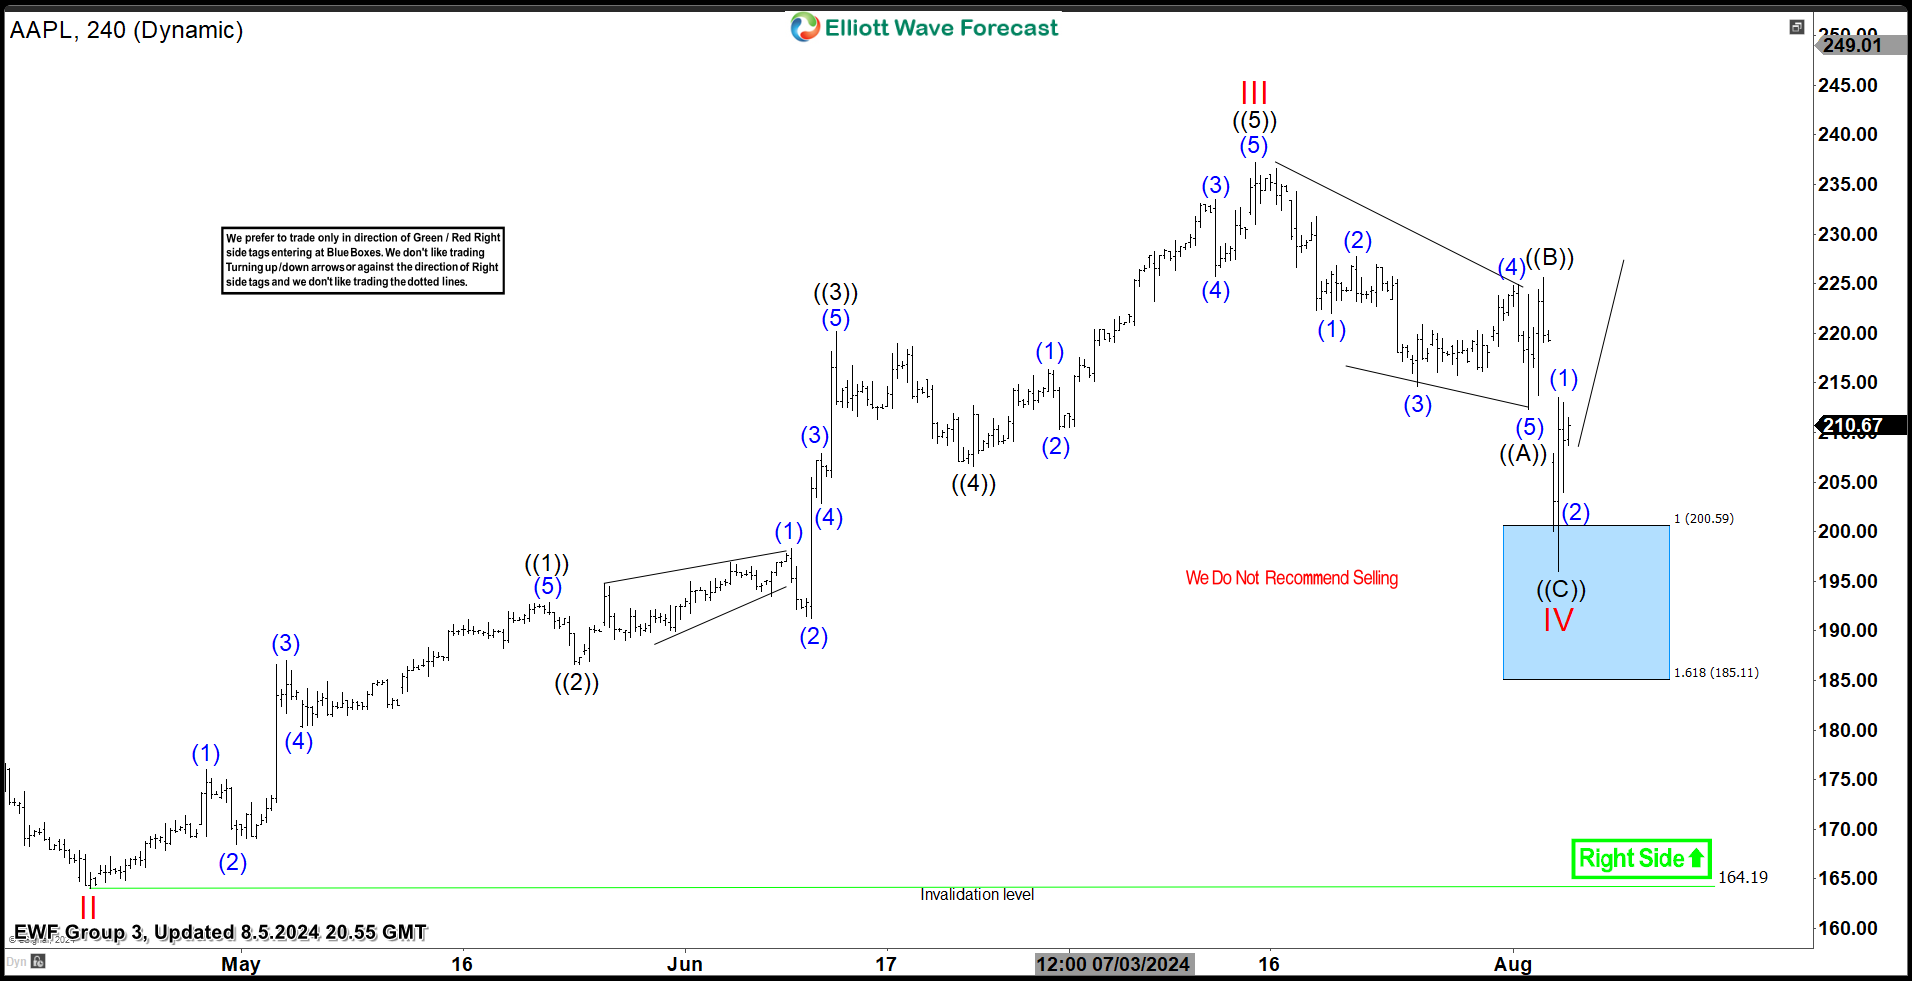
AAPL H4 Update 08.05.2024
The stock has given us correction against the 164.19 low. The pullback has already reached the extreme zone (Blue Box) and giving us reaction from there. At this stage, we advise against selling the stock and favor the long side from the marked H4 Blue Box area. AAPL could either see a rally to new highs or a larger corrective bounce in at least three waves. A quick reminder: Our charts are designed for simplicity and ease of trading:
- Red bearish stamp + blue box = Selling Setup
- Green bullish stamp + blue box = Buying Setup
- Charts with Black stamps are deemed non-tradable. 🚫
If you want to learn more about Elliott Wave Patterns, we invite you to explore our Free Elliott Wave Educational Web Page. 
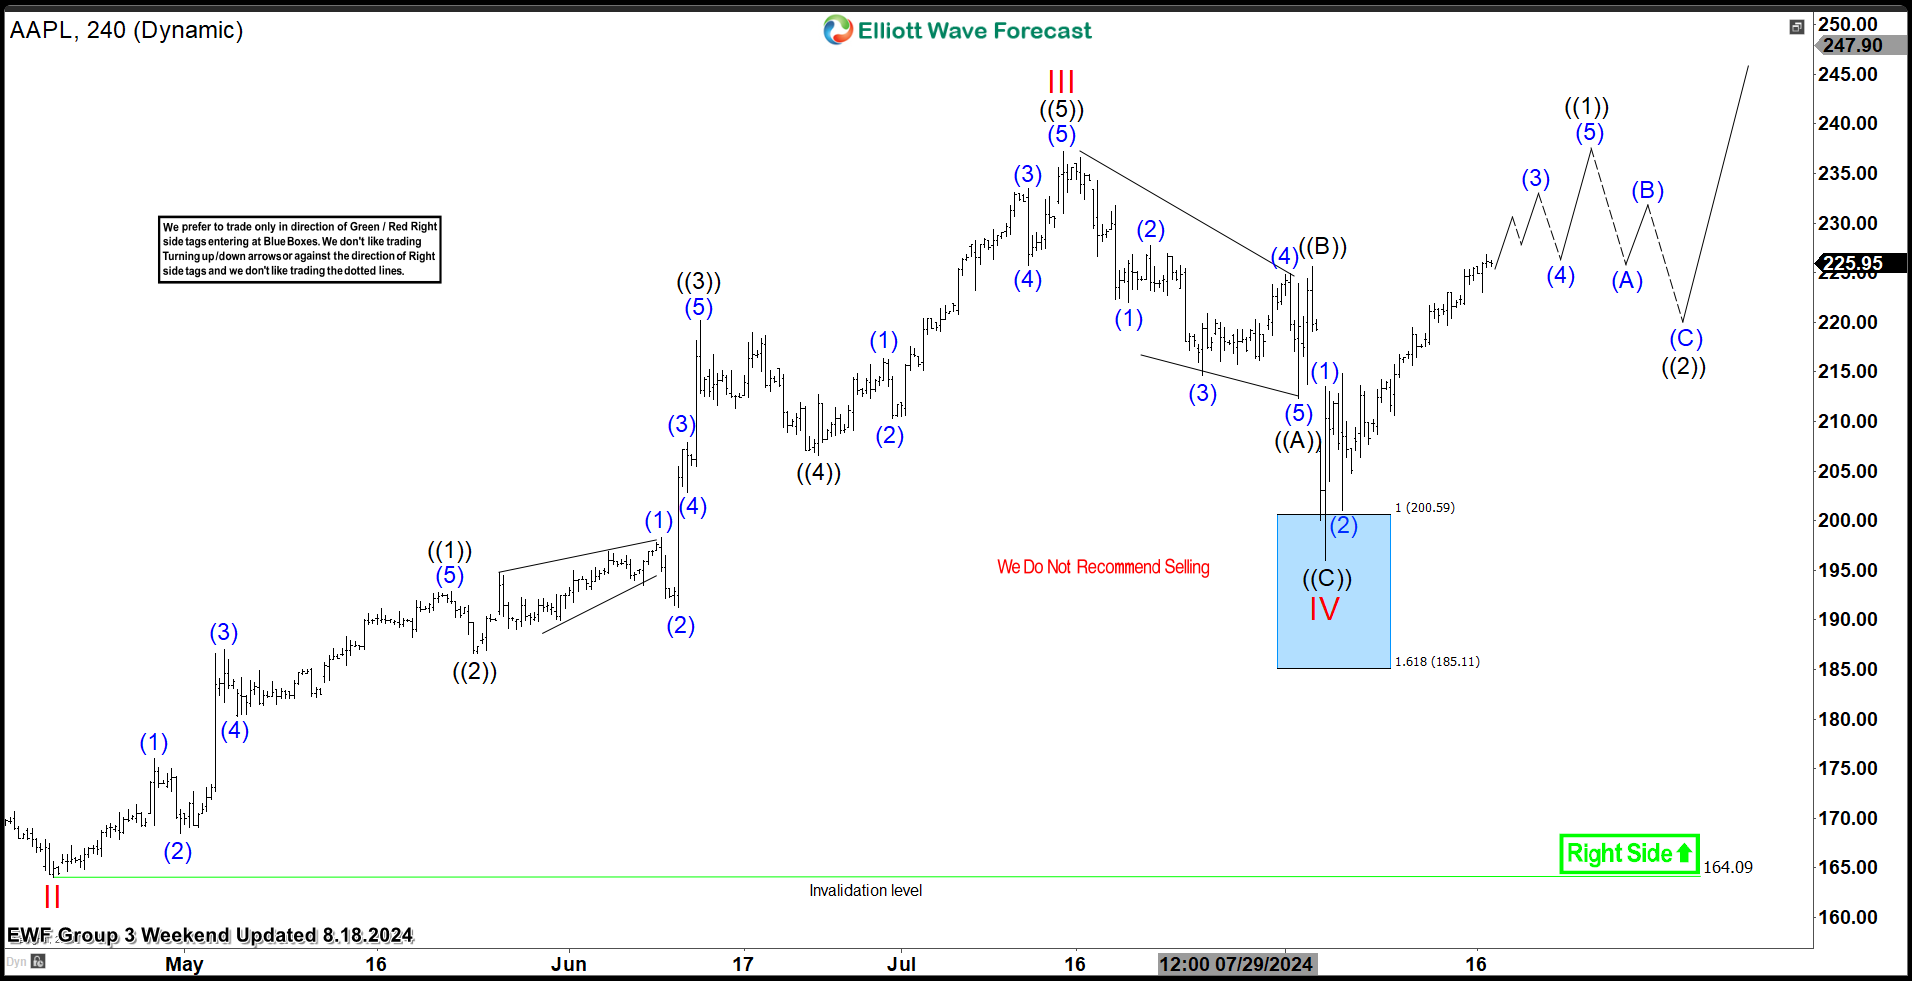
AAPL H4 Update 08.18.2024
The stock responded exactly as anticipated at the Blue Box Area, attracting buyers and initiating a substantial rally from our recommended buying zone. We would like to see break of III red peak to confirm next leg up is in progress. To capitalize on these opportunities and stay ahead, consider exploring our expert services and insights. For the latest updates, refer to the most recent charts available in our membership area. We focus on trading instruments with incomplete bullish or bearish swing sequences. The Live Trading Room highlights the best opportunities in real-time. 
The post Apple Stock (AAPL) Elliott Wave : Buying the Dips at the Blue Box Area appeared first on Elliott wave Forecast.


