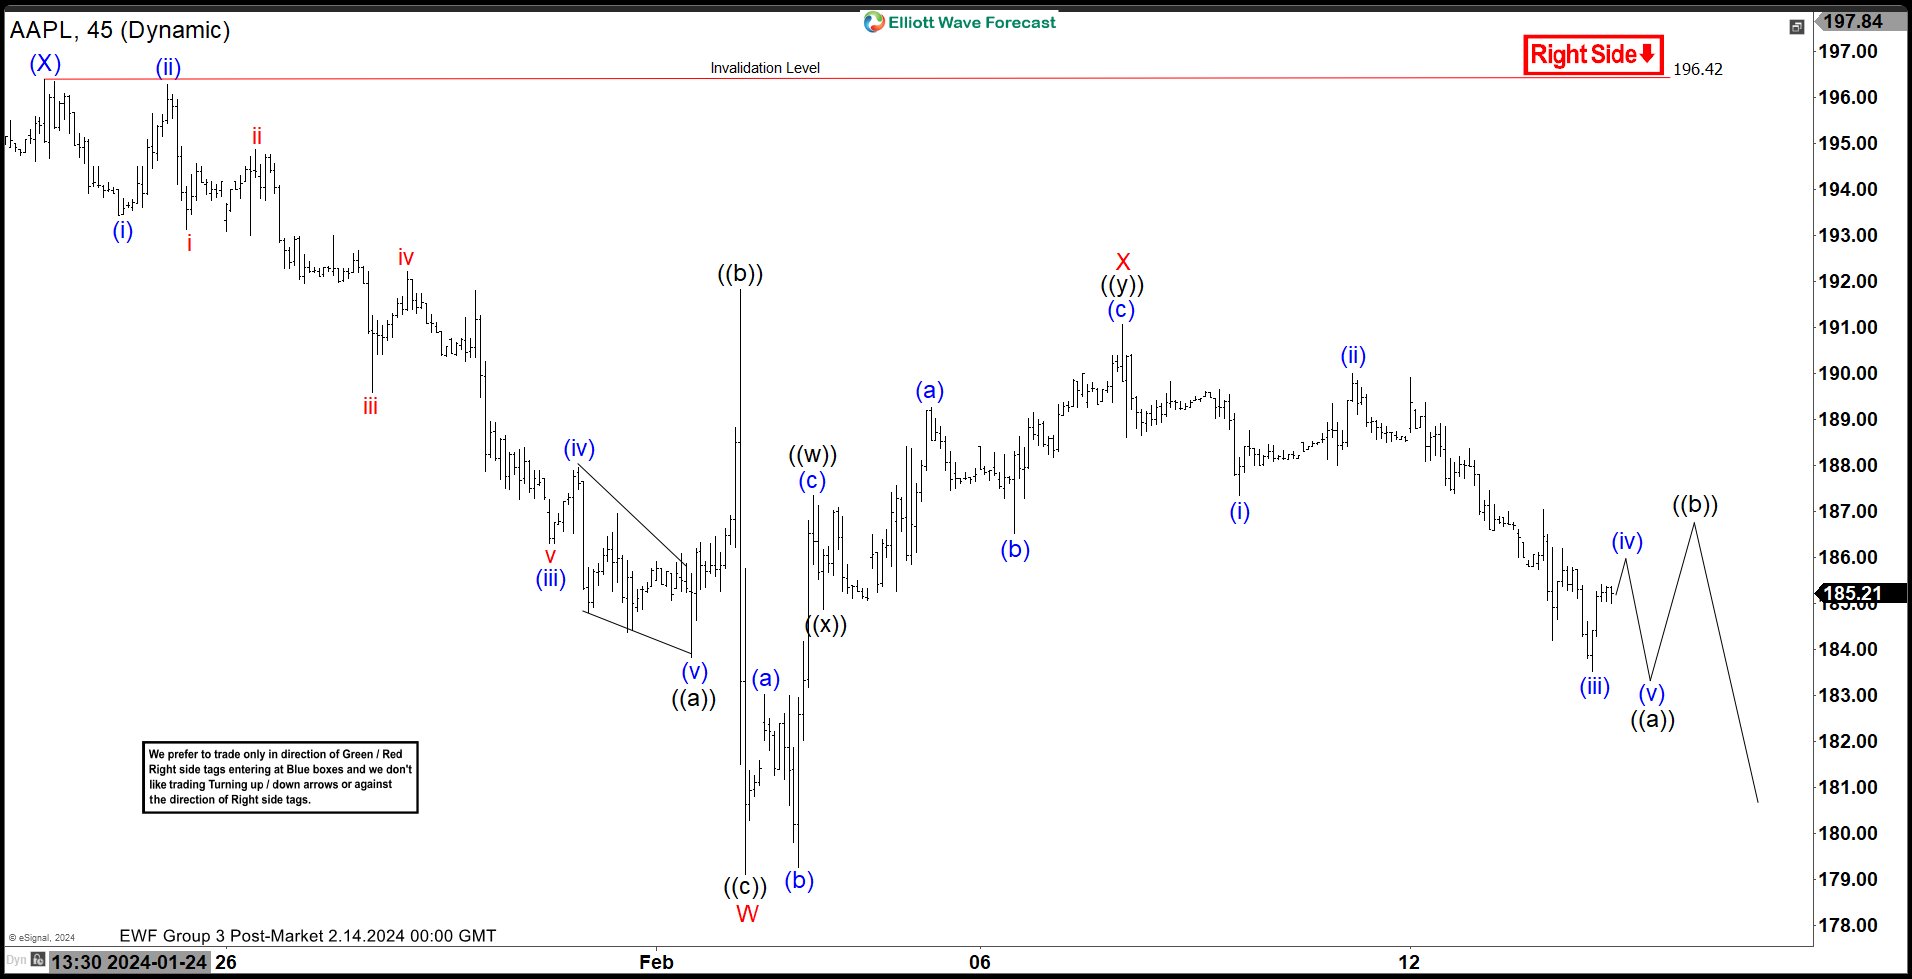
Apple (AAPL) made a new all-time high on December 14, 2023 at 199.62. Down from there, a correction is in progress with internal subdivision as a double three Elliott Wave structure. Down from 12.14.2023, wave (W) ended at 179.68 and wave (X) ended at 196.42 as the 45 minutes chart below shows. Wave (Y) lower is in progress with internal structure as another double three in lesser degree. Down from wave (X), wave ((a)) ended at 183.81 and wave ((b)) ended at 191.81. Wave ((c)) lower ended at 179.10 which completed wave W. Up from there, wave ((w)) ended at 187.33 and wave ((x)) ended at 184.85. Wave ((y)) ended at 191.05 which completed wave X. The stock has turned lower in wave Y. Down from wave X, wave (i) ended at 187.35 and wave (ii) rally ended at 189.99. Wave (iii) lower ended at 183.51. Expect the stock to rally in wave (iv) then turn lower in wave (v) to end wave ((a)). It should then rally in wave ((b)) before turning lower again in wave ((c)) of Y. Near term, as far as pivot at 196.42 high stays intact, expect rally to fail in 3, 7, or 11 swing for further downside.
Apple (AAPL) 45 Minutes Elliott Wave Chart
AAPL Elliott Wave Video
The post Apple (AAPL) Should See Further Downside appeared first on Elliott Wave Forecast : Analysis and Trading Signals.


