

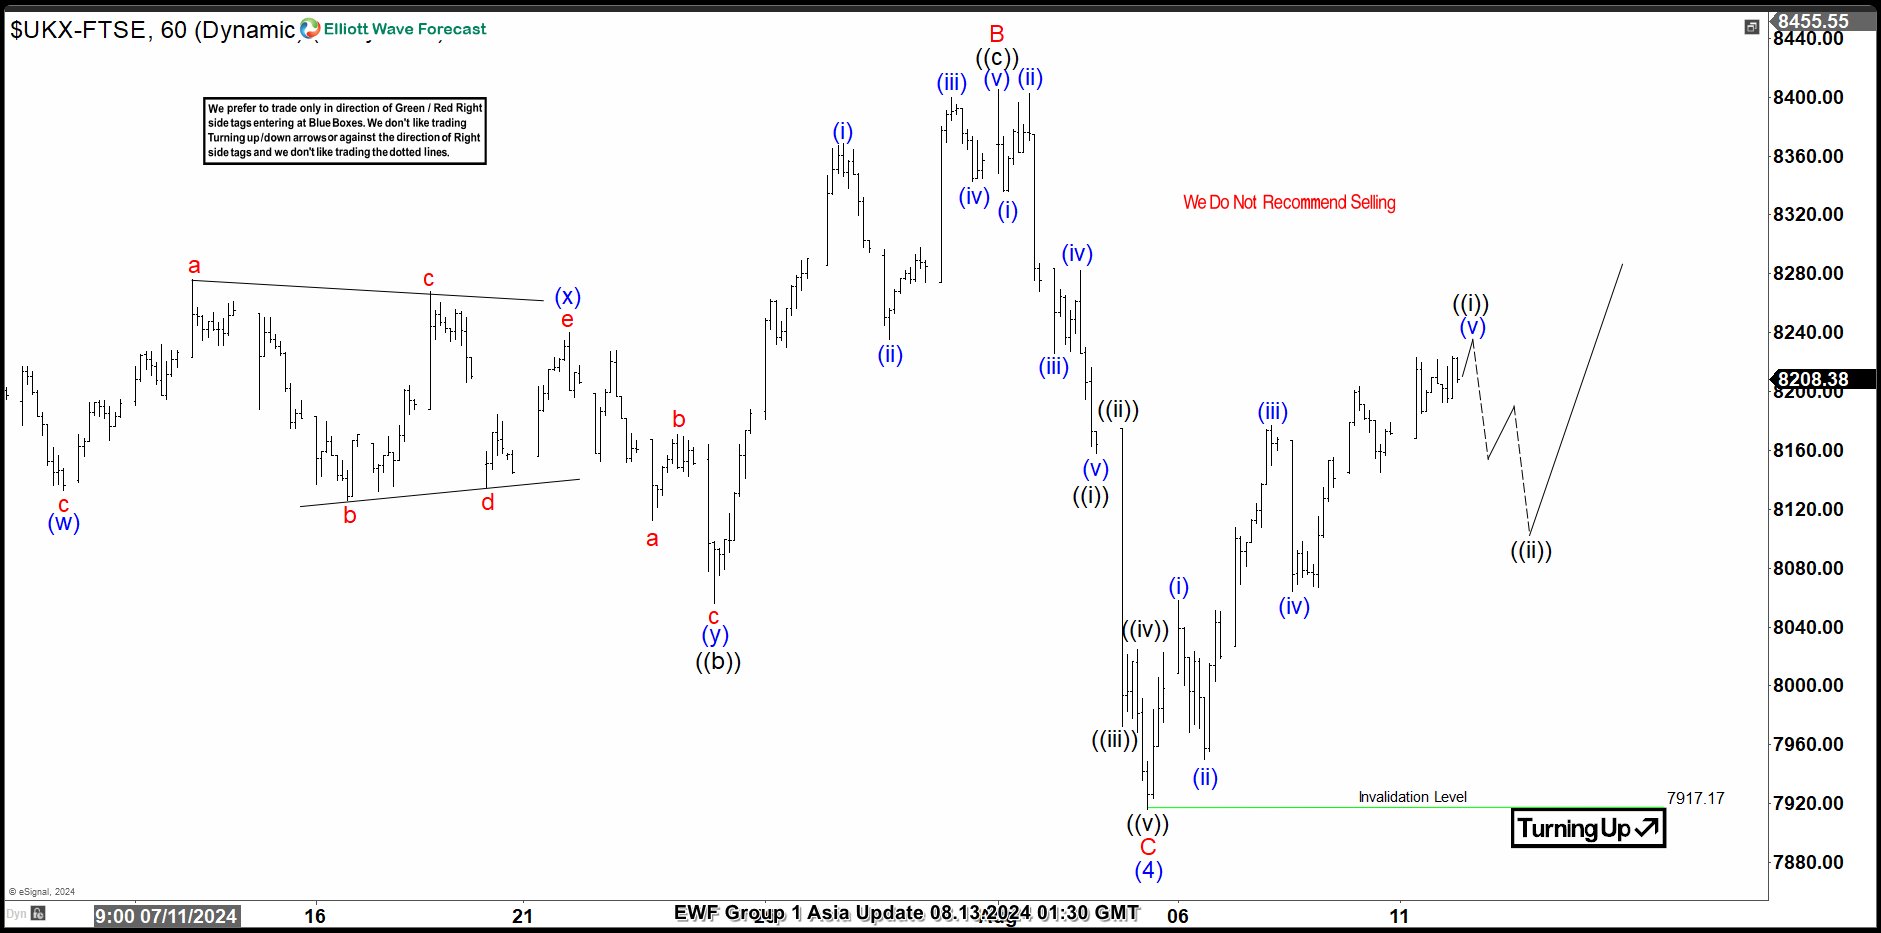
Short Term Elliott Wave in FTSE suggests that the index has completed a bearish sequence from 5.15.2024 high. The decline made a zig zag Elliott Wave structure. Down from 5.15.2024 high, wave A ended at 8106.79 low. Rally in wave B ended at 8405.24 high with internal subdivision as an expanded flat structure. Up from wave A, wave ((a)) ended at 8279.75 and wave ((b)) ended at 8056.01. Wave ((c)) higher ended at 8405.24 which completed wave B in higher degree. Then, FTSE turned lower in wave C with internal subdivision as an impulse structure. Down from wave B, wave ((i)) ended at 8158.03 low and wave ((ii)) ended slightly up at 8174.71 high. Wave ((iii)) lower ended at 7972.35 and wave ((iv)) ended at 8024.83 high. Final leg wave ((v)) ended at 7915.94 low which completed wave C and (4) in higher degree. The current rally is in progress expecting to continue higher as wave (5). Near term, we are calling an impulse structure as wave ((i)) from wave (4) low. This wave ((i)) should be completed very soon and we are expecting a retracement in 3, 7 or 11 swings as wave ((ii)) before resuming the rally. The view is valid as price action remains above 7915.94 low.
FTSE 60 Minutes Elliott Wave Chart
FTSE Elliott Wave Video
The post Elliott Wave Intraday Analysis: FTSE should Continue Higher appeared first on Elliott wave Forecast.


