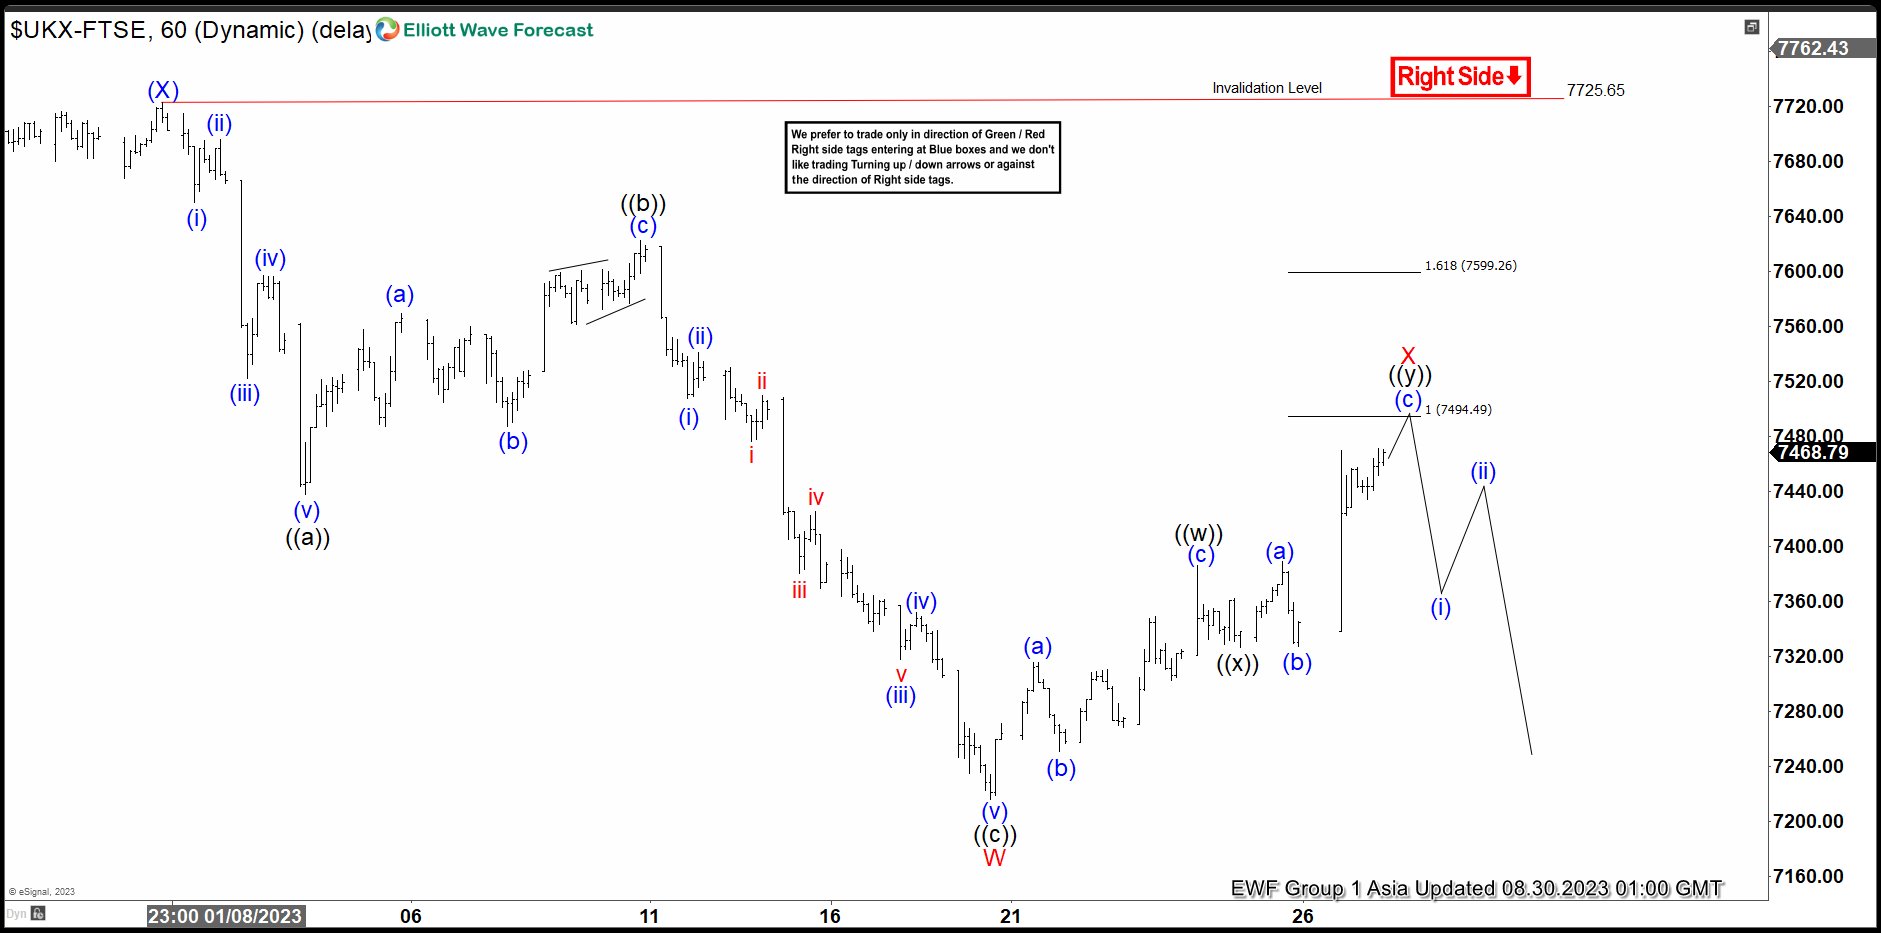
FTSE Index shows a bearish sequence from 4.21.2023 high favoring further downside. The decline from 4.21.2023 high is currently unfolding as a double three Elliott Wave structure. Down from 4.21.2023 high, wave (W) ended at 7229.57 and rally in wave (X) ended at 7725.65. The Index has resumed lower in wave (Y). The internal subdivision of wave (Y) is unfolding as another double three in lesser degree. Down from wave (X), wave ((a)) ended at 7437.88 and rally in wave ((b)) ended at 7622.92. The third leg lower wave ((c)) ended at 7215.76 which completed wave W in higher degree. Wave X rally is now in progress as a double three. Up from wave W, wave ((w)) ended at 7386.08 and pullback in wave ((x)) ended at 7326.48. Expect wave ((y)) to extend higher towards 7493.79 – 7598.57 area and this should complete wave X in higher degree. Afterwards, Index should turn lower in wave Y. Potential target lower is 100% – 161.8% Fibonacci extension from 2.16.2023 high towards 6560 – 7086.2. Near term, as far as pivot at 7725.65 high stays intact, expect rally to fail in 3, 7, or 11 swing for further downside.
FTSE 60 Minutes Elliott Wave Chart
FTSE Elliott Wave Video
The post Elliott Wave View: FTSE Rally Expected to Turn Lower appeared first on Elliott Wave Forecast : Analysis and Trading Signals.


